Tezos Price Forecast: XTZ to mimic Filecoin and surge another 70%
- Tezos price stubbornly holding the 10-day simple moving average (SMA) on pullbacks in April.
- Tenderbake confirms transactions are finalized as soon as a block is created.
- Daily and weekly Relative Strength Indexes (RSI) slightly overbought but not an obstacle.

Tezos price closed above the topside trendline on April 5 with a daily gain of 19% after failing three of the previous four days. Price action since breaking out has been sloppy, but initial profit targets first mentioned in an April 1 FXStreet post have been reached. However, based on the Filecoin precedent after its breakout above a topside trendline, XTZ speculators could see a further 70% gain from the current price.
Tezos price welcomes the major step forward in the new upgrade
Nomadic Labs’ recently released a Tezos test net, and it will be running a new type of consensus algorithm called Tenderbake. It uses a classical BFT consensus algorithm that seamlessly adapts to manage an arbitrarily large number of validators. The result is that users can be sure their transactions are finalized as soon as the block is created and quickens XTZ’s progress towards a fully-featured economic protocol.
Currently, XTZ is trading slightly below the 138.2% extension at $6.70 after reaching the 161.8% extension at $7.35. It is reasonable to expect some resistance at this point, but it is important to note that the rally has found support at the 10-day SMA, keeping any pullback to small percentages.
On March 26, Filecoin smashed through a topside trend line and rallied around 112% over the next few days. XTZ rally could unfold similarly, albeit slower than Filecoin. A rally of 112% from the topside trendline break for XTZ would lift the price to $11.30, beyond the 261.8% Fibonacci extension of the February crash at $10.10.
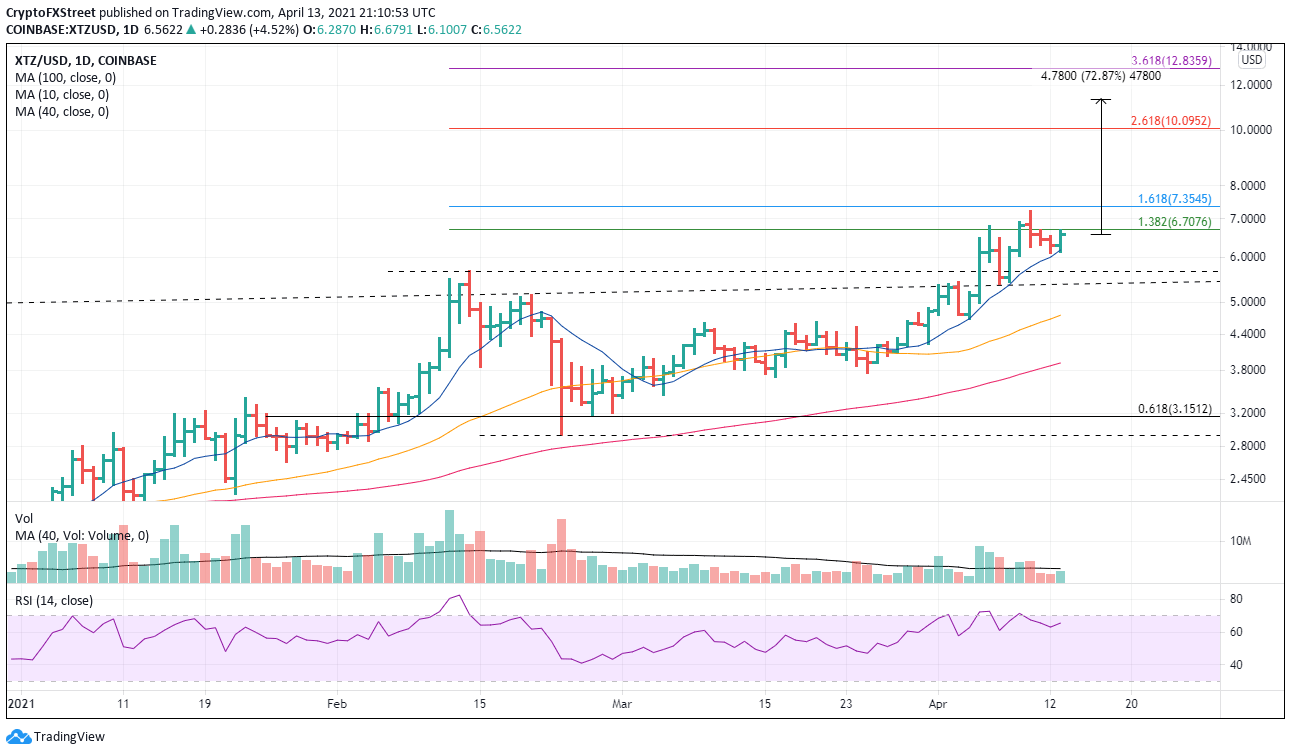
XTZ/USD daily chart
In the short term, speculators should continue to monitor the 10-day SMA on pullbacks. If there is a daily close below, it will signal a February high test at $5.66 and possibly a retest of the topside trend line around $5.39. Any further weakness would neutralize the bullish outlook.
Author

Sheldon McIntyre, CMT
Independent Analyst
Sheldon has 24 years of investment experience holding various positions in companies based in the United States and Chile. His core competencies include BRIC and G-10 equity markets, swing and position trading and technical analysis.



