Tezos Price Analysis: XTZ may add another 35% to the new rally
- Tezos price has gained 17% this week.
- A successful breakout over topside trend line key to bullish outlook.
- Volume expansion would add credibility to the rally.

Tezos price is breaking out from a three-week consolidation process along the 10-week simple moving average (SMA). A clear breach of the topside trend line at $5.37 will break the precedent of a failed breakout in February.
Tezos price not overbought on the long-term charts
Since the beginning of 2021, XTZ has constantly held the 10-week SMA on a closing basis, demonstrating consistent, almost methodological demand for the altcoin.
If the rally continues this week, the first resistance will be the topside trend line at $5.37, followed by the February high at $5.66. Still, traders should set their sights on the 1.382 Fibonacci extension of the February correction at $6.71, delivering a gain of 35% from the current price. An aggressive target is the 1.618 extension level at $7.35.
To be detailed, traders should go beyond the apparent levels and consider that XTZ reached a 100% deviation from the 40-week SMA at the August 2020 high. At the February high, it reached a 110% deviation from the moving average. Splitting them down the middle would equal a price target of $6.10.
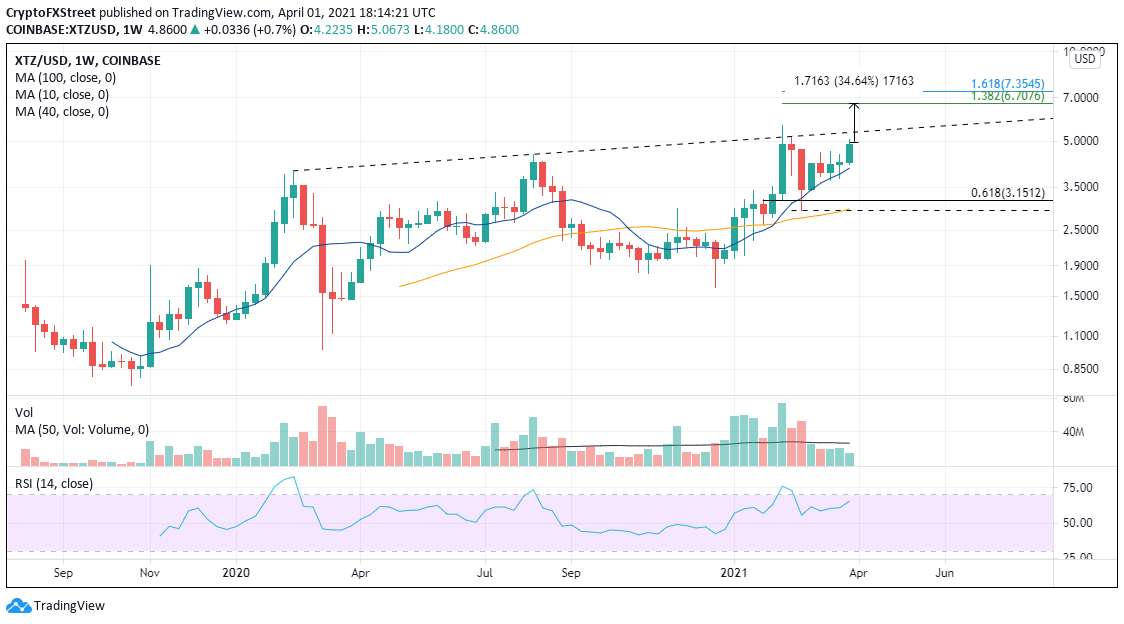
XTZ/USD weekly chart
A rejection at the topside trend line on a weekly closing basis would raise the odds that XTZ will revert to the 10-week SMA at $4.06. Subsequent support may appear at the 0.618 Fibonacci retracement of the rally from the December low at $3.15. A more critical foothold is the February low convergence with the 40-week SMA at $2.92-$2.95.
Author

Sheldon McIntyre, CMT
Independent Analyst
Sheldon has 24 years of investment experience holding various positions in companies based in the United States and Chile. His core competencies include BRIC and G-10 equity markets, swing and position trading and technical analysis.


