Tezos Price Analysis: XTZ creeps above key resistance even as key technicals turn bearish
- Tezos has flipped the 50-day SMA from resistance to support.
- The hourly chart has flashed the sell signal in the TD sequential indicator.

Since November 4, Tezos has been on an upswing as it managed to rise from $1.87 to $2.13. This following a downswing wherein the price dropped from $2.40 to $1.87 between October 13 and November 3. Let’s judge the future price action by checking out some technical analysis in different time-frames.
Tezos flips 50-day SMA from resistance to support
During the current upswing, the "Ethereum killer" has crept above the 50-day SMA ($2.12). By taking advantage of this support level, the buyers will aim to conquer the $2.40 resistance barrier, which has thwarted the price before. The relative strength index (RSI) is hovering in the neutral zone, which shows that the price has more room to grow.
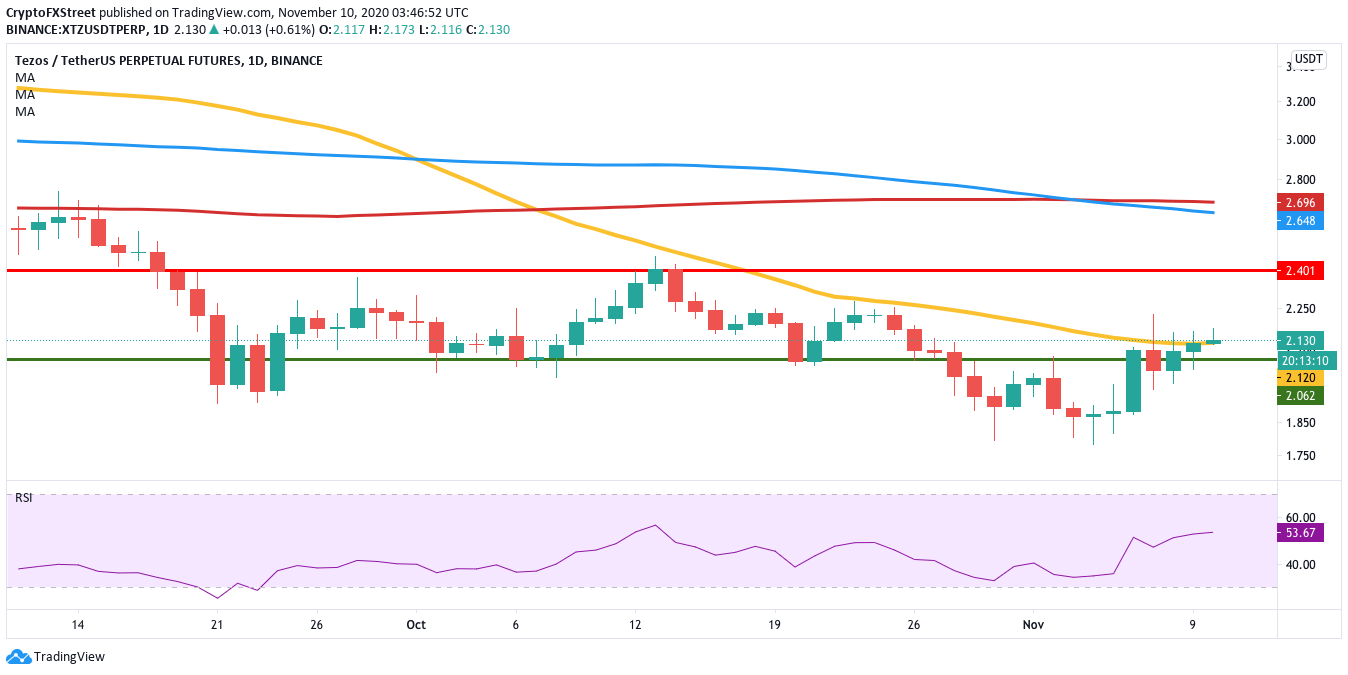
XTZ/USDT daily chart
However, the hourly chart shows that the overall outlook isn’t that optimistic. In this time-frame, XTZ has flashed a sell signal with a green-nine candlestick in the TD sequential indicator. The last time the chart flashed this signal, XTZ dropped from $2.14 to $2.04 in 17 sessions. The 50-bar SMA ($2.10) is a healthy support wall that should cap off the downside.
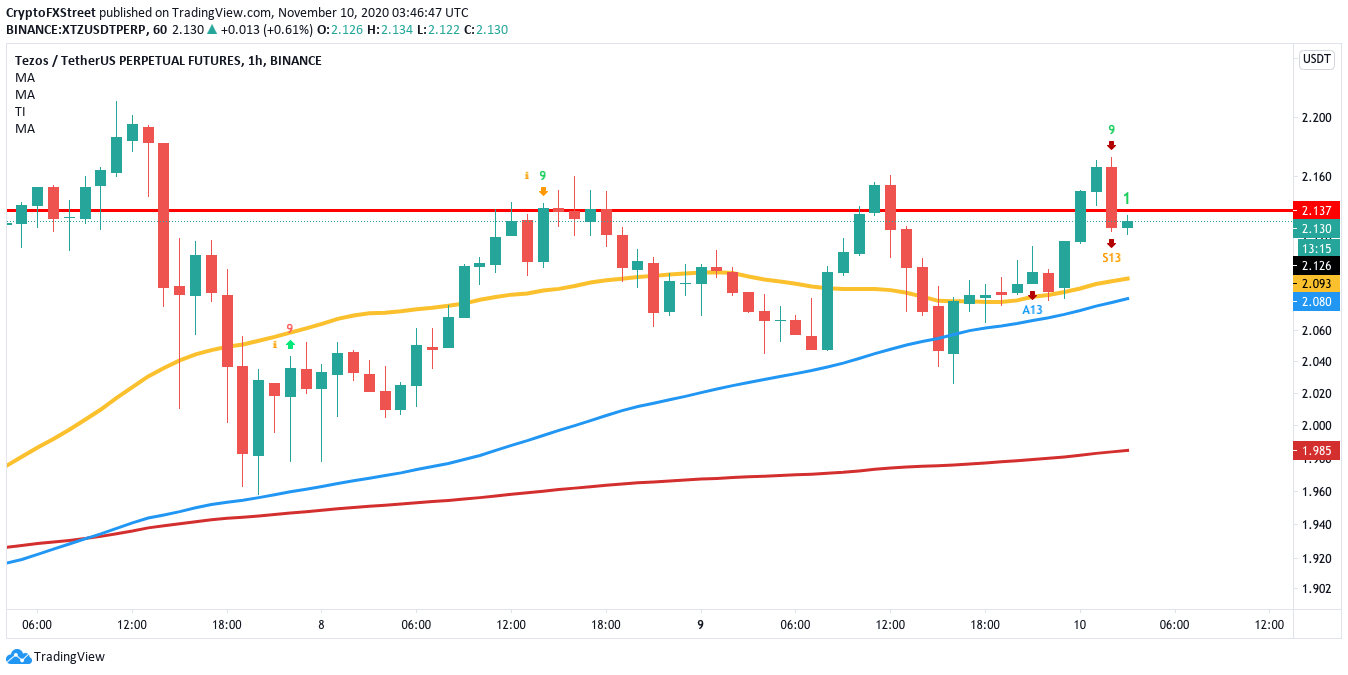
XTZ/USDT hourly chart
Tezos looks like it will correct itself in the short-term with the 50-bar SMA ($2.10) in the hourly chart acting as a possible target. However, the bulls can regain momentum and aim for the $2.40 resistance barrier. It should be noted that the short-term correction can be invalidated by the 50-day SMA ($2.12), which has previously acted as strong resistance and should now behave like healthy support.
Author

Rajarshi Mitra
Independent Analyst
Rajarshi entered the blockchain space in 2016. He is a blockchain researcher who has worked for Blockgeeks and has done research work for several ICOs. He gets regularly invited to give talks on the blockchain technology and cryptocurrencies.


