Tezos appears to mimic Chainlink’s price action, suggesting massive breakout ahead
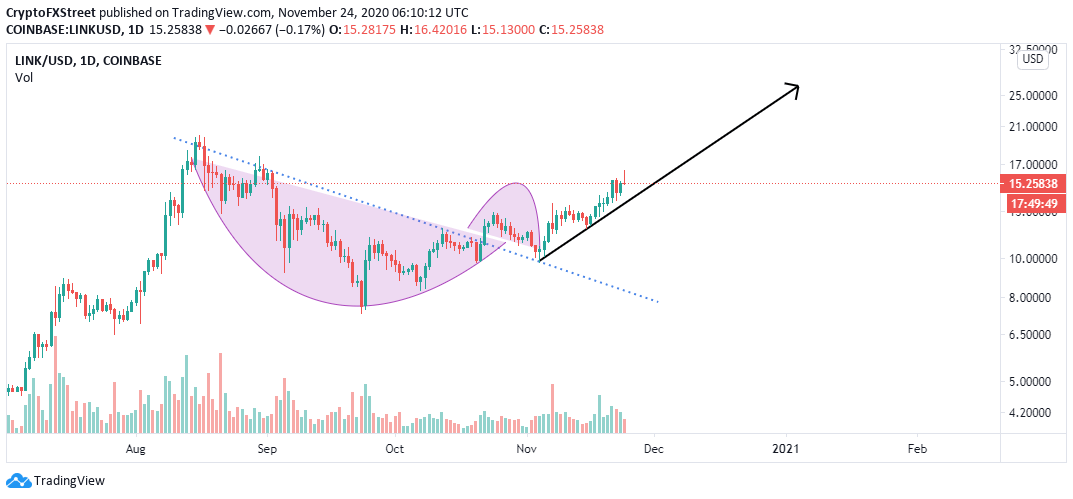
- Chainlink price breaks above $16, paving the way for gains eyeing $18 and $20, respectively.
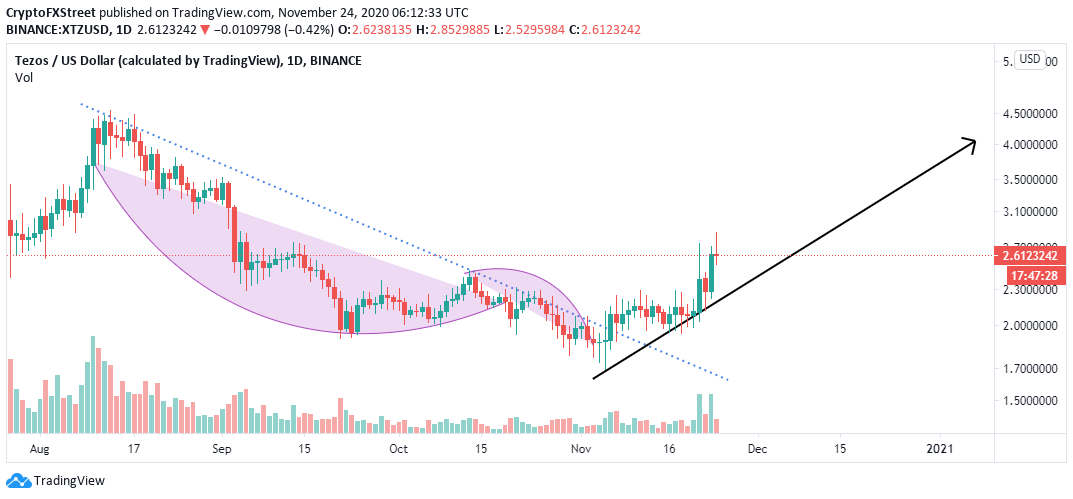
- Tezos follows in Chainlink’s footsteps and is likely to rally to $4 and August’s peak at $4.6.

Cryptoassets across the board have engaged thrust boosters, with many already trading at new yearly highs. Chainlink appears to be in the lead, with Tezos mirroring its price actions. The two digital assets’ technical pictures look very similar at the moment while pointing towards an eventual breakout.
Tezos and Chainlink on the cusp of a massive upswing
A glance at the XTZ chart illustrates a broken downtrend. The last stroke to the breakdown from August 2020 high at $4.46 occurred following the minor slump to slightly under $2.
Meanwhile, Tezos appears to have resumed the uptrend for gains eyeing $3 in the short term. If the price closes the day above the 200-day Simple Moving Average, we are likely to see a massive spike above $3 come into the picture,
 (20)-637417967921179122.png)
XTZ/USD daily chart
Chainlink displays a similar picture to that of Tezos; however, its price action has been drastic and in the lead. The downtrend from the 2020 high at $20 hit bottom slightly above $7, allowing buyers to regain control over the price. LINK/USD uptrend eyes $18 on the road to hitting new yearly highs.
-637417968336378360.png)
LINK/USD daily chart
For now, holding above $16 is critical to completing the final leg to $18 and $20, respectively. Besides, the Relative Strength suggests the least resistance path is upwards, especially now that it is entering the overbought region for the first time since August.
In case Tezos rises above the yearly high at $20, buyers are likely to react by increasing their positions and aiming to take advantage of the price discovery. Beyond this crucial level, the next target is $28.5.
LINK/USD daily chart
Tezos has also embarked on the journey of breaking barriers following the reversal discussed above. The next target, after the resistance at $3, is $4. If massive buy orders are triggered, XTZ could start a bull cycle to new yearly highs.
XTZ/USD daily chart
Chainlink and Tezos appear to be following the same growth pattern. Therefore, watching out for both assets side by side could provide a clear picture of where the recently started uptrends will end. For now, LINK bulls’ attention has been channeled to breaking the hurdles at $16 and $20. Tezos has focused on breaking above $3.
Author

John Isige
FXStreet
John Isige is a seasoned cryptocurrency journalist and markets analyst committed to delivering high-quality, actionable insights tailored to traders, investors, and crypto enthusiasts. He enjoys deep dives into emerging Web3 tren


