- The declining trend unfolds into three sets of impulsive waves.
- Terra's volume remains skewed since the rug-pull crash in May.
- Invalidation of the bullish idea is a breach above $7.77.
Terra Luna's price may be headed lower than investors may be thinking. Key levels have been defined.
Tera's LUNA price could take investors by surprise in the coming days. Since August, the forecast was made that LUNA could potentially 10x in market value based on on-chain and technical analysis. During the second week of September, LUNA pulled off a whopping 3x rally within 24 hours, which was a positive affirmation of the flamboyant 10x hypothesis.
Terra's Luna price could be 10x if history repeats itself
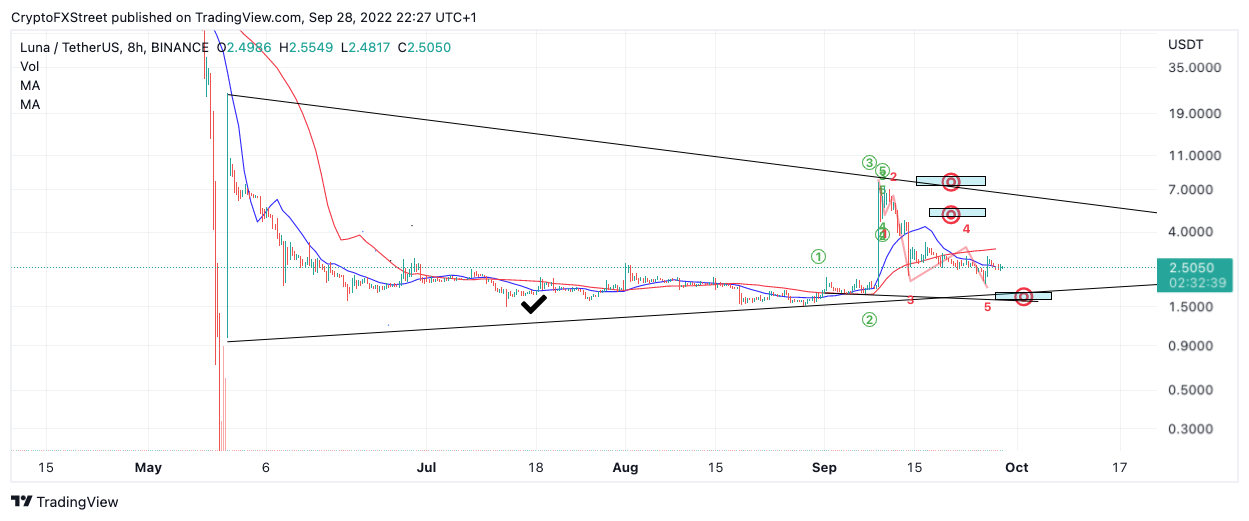
LUNA price currently auctions at $2.50 as the bulls are struggling to hold support at the 8-day moving average. Since the 3x bull run, the bears have taken over the market, forging a 65% decline within two weeks. When subdividing the wave count of the downtrend, it is possible to fit three sets of impulsive 5-wave structures.
This is a problematic signal for inventors in the market and a stay-out-of-the-way indicator for those that have remained. Additionally, the volume profile indicator remains skewed from the rug-pull crash during May. Thus, properly identifying the strength of the bulls amidst the recent 300% rise is even more challenging.
LUNA 4-Hour Chart
Although LUNA's on-chain metrics have shown considerable bullish gestures, having an alternative thesis can be beneficial when understanding when markets change. Based on the recent price action, this forecast considers an additional 35% decline as a possible outcome for the Terra LUNA price. Such a move would contribute to a much broader symmetrical triangle thesis that would lock LUNA's price into more range-bound price action between $1.65 and $4.00 throughout Q4.
Invalidation of the bearish thesis targeting $1.65 is a breach above the recent swing high at $7.77. If the bulls can breach this level, the 10x rally would likely be underway. A $28 target could result in a more than 1,000% increase from the current LUNA price.
In the following video, our analysts deep dive into the price action of LUNA, analyzing key levels of interest in the market. -FXStreet Team
Information on these pages contains forward-looking statements that involve risks and uncertainties. Markets and instruments profiled on this page are for informational purposes only and should not in any way come across as a recommendation to buy or sell in these assets. You should do your own thorough research before making any investment decisions. FXStreet does not in any way guarantee that this information is free from mistakes, errors, or material misstatements. It also does not guarantee that this information is of a timely nature. Investing in Open Markets involves a great deal of risk, including the loss of all or a portion of your investment, as well as emotional distress. All risks, losses and costs associated with investing, including total loss of principal, are your responsibility. The views and opinions expressed in this article are those of the authors and do not necessarily reflect the official policy or position of FXStreet nor its advertisers. The author will not be held responsible for information that is found at the end of links posted on this page.
If not otherwise explicitly mentioned in the body of the article, at the time of writing, the author has no position in any stock mentioned in this article and no business relationship with any company mentioned. The author has not received compensation for writing this article, other than from FXStreet.
FXStreet and the author do not provide personalized recommendations. The author makes no representations as to the accuracy, completeness, or suitability of this information. FXStreet and the author will not be liable for any errors, omissions or any losses, injuries or damages arising from this information and its display or use. Errors and omissions excepted.
The author and FXStreet are not registered investment advisors and nothing in this article is intended to be investment advice.
Recommended Content
Editors’ Picks
Bitcoin likely to remain in red through the next quarter if history is any indication

Bitcoin (BTC) price produced a monthly close at $27,210, noting a -6.92% return for May. The last-minute slide in BTC put an end to the four-month bullish streak that kickstarted the 2023 rally.
Ethereum vs. SEC: Implications of Wahis’ insider trading settlement on ETH

Ethereum (ETH) is the subject of a new controversy, with the second-largest crypto finding itself in the rut after the United States Securities and Exchange Commission (SEC) settled its insider trading case against the Wahi brothers.
Justin Sun’s TRON hits all-time high of 10.9M daily transactions, braving crypto winter

Justin Sun, the founder of TRON – one of the largest decentralized blockchain DAO ecosystems in crypto – shared a new milestone for the token on Thursday. TRON processed 10.9 million in daily transactions, hitting a record high.
Ethereum fees decline by 70% from 2023 highs as top DeFi protocols lose users

Ethereum is currently facing trouble in the spot market due to the broader market bearishness as well as investors' skepticism. But while the spot market only recently took a turn for the worse, the DeFi space has been only negative for a long time.
Bitcoin: BTC delays inevitable crash to $25,000

Bitcoin price is delaying a crash that has been brewing for roughly two weeks. A failure to push higher could result in a steep correction next week. The troubling macroeconomic conditions could be key in catalyzing and trigger a nosedive for BTC holders.