- Sui’s price closes below its ascending trendline, indicating a correction ahead.
- The technical outlook suggests a pullback as momentum indicators show signs of weakness.
- Coinglass data shows that SUI’s long-to-short ratio reached the lowest level in over a month, reflecting a bearish sentiment.
Sui (SUI) price extends its decline, trading below $4.37 on Thursday after rejecting from its ascending trendline in the previous day. Coinglass data shows that SUI’s long-to-short ratio reached the lowest level in over a month, reflecting a bearish sentiment. Moreover, the technical outlook suggests a correction as momentum indicators show weakness, projecting a 30% crash ahead.
Sui price action shows signs of weakness
Sui’s price broke below the ascending trendline (drawn by connecting multiple daily close levels since November 26) on Sunday; however, it recovered slightly to retest the broken trendline on Tuesday and got rejected. A break below, retest and then rejection from the ascending trendline indicates the change in market structure from bullish to bearish. At the time of writing on Thursday, it continues to trade down around $4.37.
If SUI continues its pullback, it could extend the decline by 14% from its current levels to retest its 200-day Exponential Moving Average (EMA) at $3.75. A successful close below could extend an additional decline to test its next support level at $2.96, crashing 30% from its current level.
The Relative Strength Index (RSI) on the daily chart reads 45, below its neutral level of 50 and points downwards, indicating strong bearish momentum. Additionally, the Moving Average Convergence Divergence (MACD) indicator shows a bearish crossover on a daily basis. Moreover, it also shows rising red histogram bars below the neutral line zero, suggesting that the Sui price could experience downward momentum.
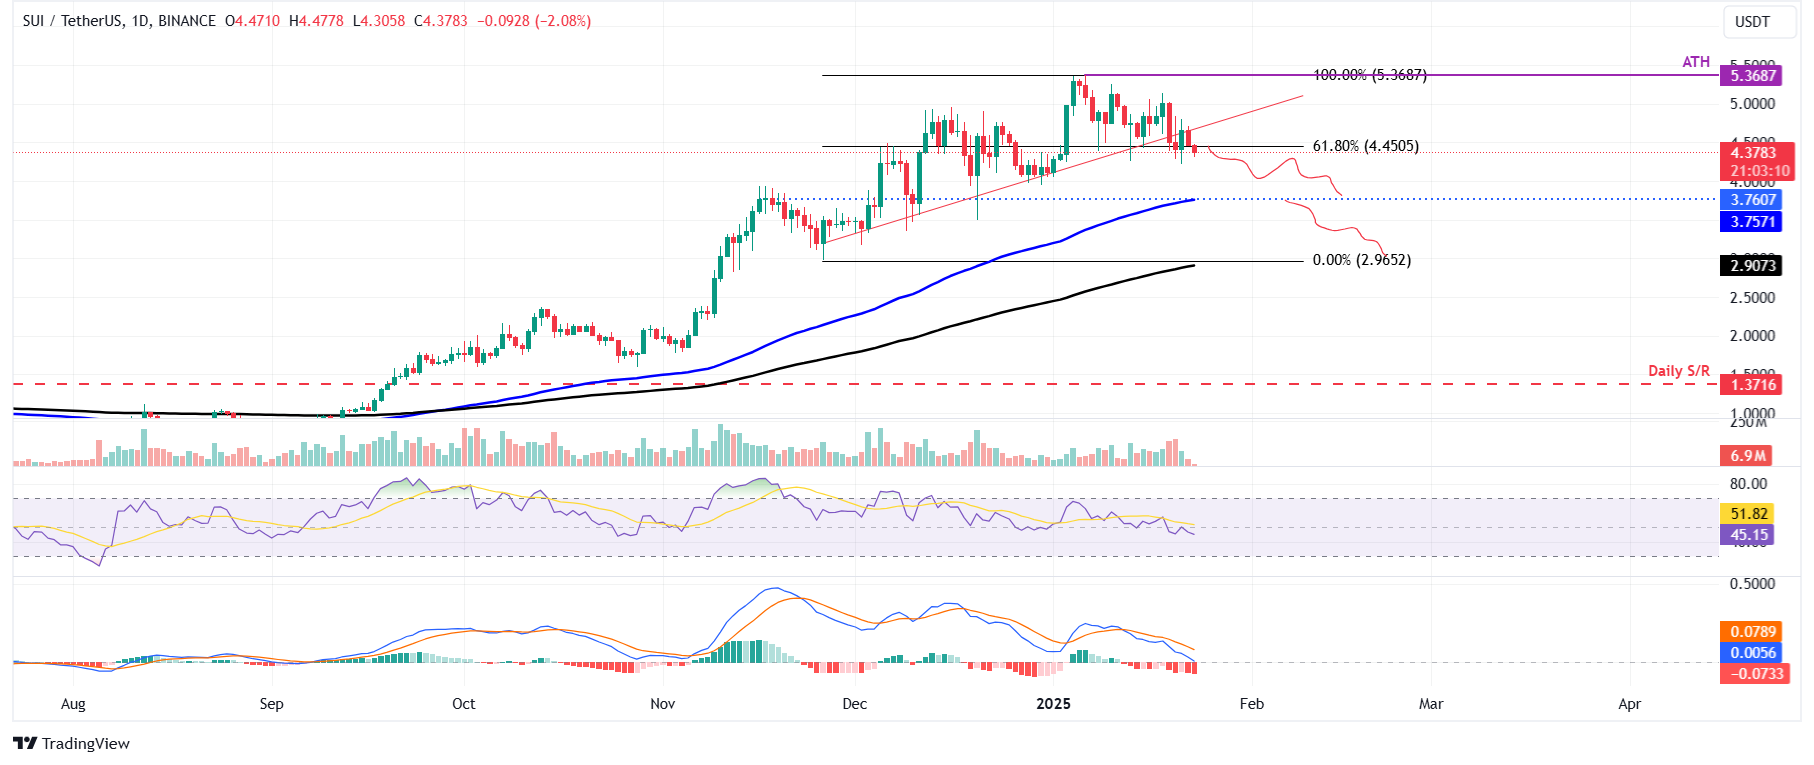
SUI/USDT daily chart
Another bearish sign is Coinglass’s Sui long-to-short ratio, which reads 0.79, the lowest level in over a month. This ratio below one reflects bearish sentiment in the markets as more traders are betting for the Sui price to fall.
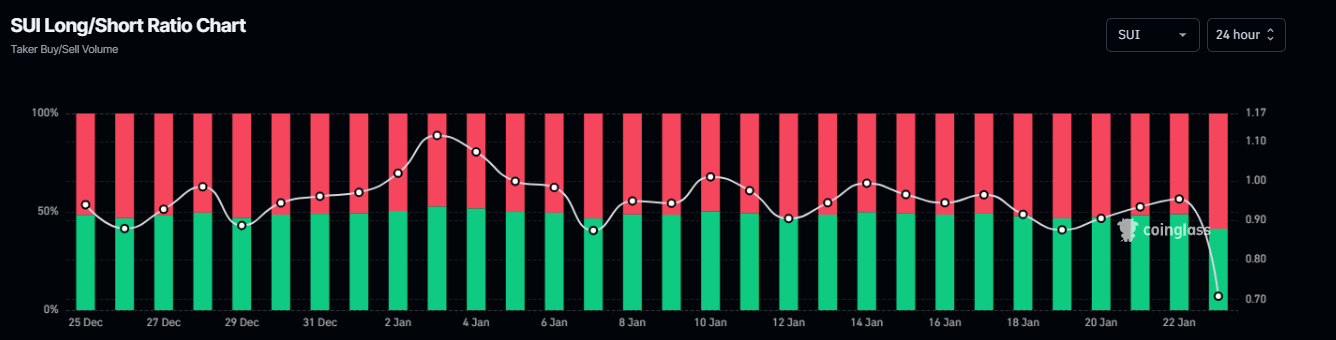
Sui long-to-short ratio chart. Source: Coinglass
Information on these pages contains forward-looking statements that involve risks and uncertainties. Markets and instruments profiled on this page are for informational purposes only and should not in any way come across as a recommendation to buy or sell in these assets. You should do your own thorough research before making any investment decisions. FXStreet does not in any way guarantee that this information is free from mistakes, errors, or material misstatements. It also does not guarantee that this information is of a timely nature. Investing in Open Markets involves a great deal of risk, including the loss of all or a portion of your investment, as well as emotional distress. All risks, losses and costs associated with investing, including total loss of principal, are your responsibility. The views and opinions expressed in this article are those of the authors and do not necessarily reflect the official policy or position of FXStreet nor its advertisers. The author will not be held responsible for information that is found at the end of links posted on this page.
If not otherwise explicitly mentioned in the body of the article, at the time of writing, the author has no position in any stock mentioned in this article and no business relationship with any company mentioned. The author has not received compensation for writing this article, other than from FXStreet.
FXStreet and the author do not provide personalized recommendations. The author makes no representations as to the accuracy, completeness, or suitability of this information. FXStreet and the author will not be liable for any errors, omissions or any losses, injuries or damages arising from this information and its display or use. Errors and omissions excepted.
The author and FXStreet are not registered investment advisors and nothing in this article is intended to be investment advice.
Recommended Content
Editors’ Picks

Donald Trump backed World Liberty Financial triples Ethereum holdings ahead White House Crypto Summit
Donald Trump’s World Liberty Financial increased its Ethereum holdings nearly threefold on Thursday, buying the recent ETH price dip. Ethereum hovers around $2,200, up nearly 1.5% on Thursday.

White House Crypto Summit: What investors should know
The upcoming first-ever White House Crypto Summit will be held on Friday. The event will unite key industry leaders to explore how regulation and innovation can shape the cryptocurrency market's future.

Bitcoin recovers above $92,000 ahead of first-ever White House Crypto summit
Bitcoin extends recovery and trades above $92,000 on Thursday after rallying 5% in the last two days. A Glassnode report highlights that Bitcoin’s market reaction hinges on the $92,000, a key level for momentum, while $71,000 serves as critical support if BTC declines.

Chainlink bulls target a 30% upside as key support holds strong
Chainlink extends its gains by more than 4% on Thursday, trading around $17.22 after rallying nearly 13% in the last two days. On-chain data suggest a rally ahead as LINK's long-to-short ratio reaches its highest monthly level and its funding rates are positive.

Bitcoin: BTC bloodbath continues, near 30% down from its ATH
Bitcoin (BTC) price extends its decline and trades below $80,000 at the time of writing on Friday, falling over 15% so far this week. This price correction wiped $660 billion of market capitalization from the overall crypto market and saw $3.68 billion in total liquidations this week.

The Best brokers to trade EUR/USD
SPONSORED Discover the top brokers for trading EUR/USD in 2025. Our list features brokers with competitive spreads, fast execution, and powerful platforms. Whether you're a beginner or an expert, find the right partner to navigate the dynamic Forex market.