SUI Price Forecast: On-chain metrics and technical indicators show bearish bias
- SUI’s technical analysis shows a formation of bearish divergence on a momentum indicator.
- On-chain data suggests a bearish outlook for SUI as the long-to-short ratio is below one, and daily trading volume is decreasing.
- A daily candlestick close above $2.17 would invalidate the bearish thesis.
Sui (SUI) price continues to decline on Tuesday after reaching a new all-time high of $2.36 on October 13. Technical analysis and onchain data further support a short-term decline, as the formation of bearish divergence on a momentum indicator and decreasing trading volume suggest a weakening upward momentum.
Sui price shows signs of weakness
Sui’s price reached a new all-time high of $2.36 on October 13, which began declining over 14% in the next eight days. At the time of writing on Tuesday, it trades slightly down around $2.00.
Moreover, the Relative Strength Index (RSI) and the Awesome Oscillator (AO) indicator support suggest a bearish outlook in the daily chart. The higher high in SUI’s price formed on October 13 does not reflect the RSI lower high for the same period. This development is termed a bearish divergence, often leading to a trend reversal or short-term crash.
If SUI continues its decline, it could crash 18% from its current trading level of $2.00 to retest its 61.8% Fibonacci retracement level (drawn from August’s low of $0.46 to October’s high of $2.36) at $1.64.
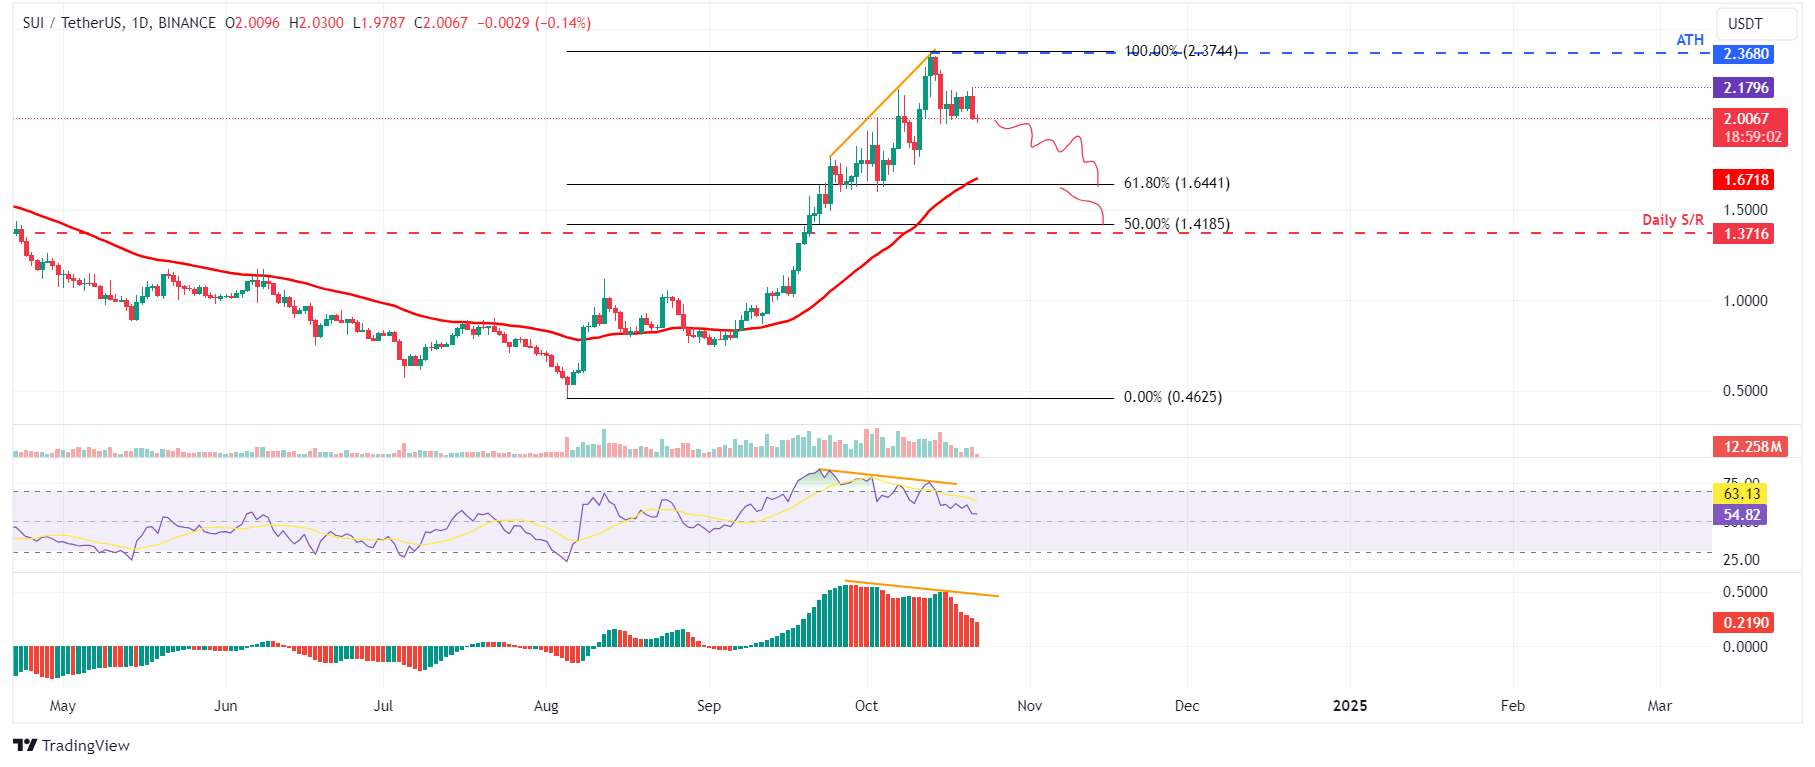
SUI/USDT daily chart
Coinglass’s data also aligns with the bearish outlook. Sui’s long-to-short ratio is 0.866, the lowest level in one month. This ratio reflects bearish sentiment in the market, as the number below one suggests that more traders anticipate the asset’s price to fall.
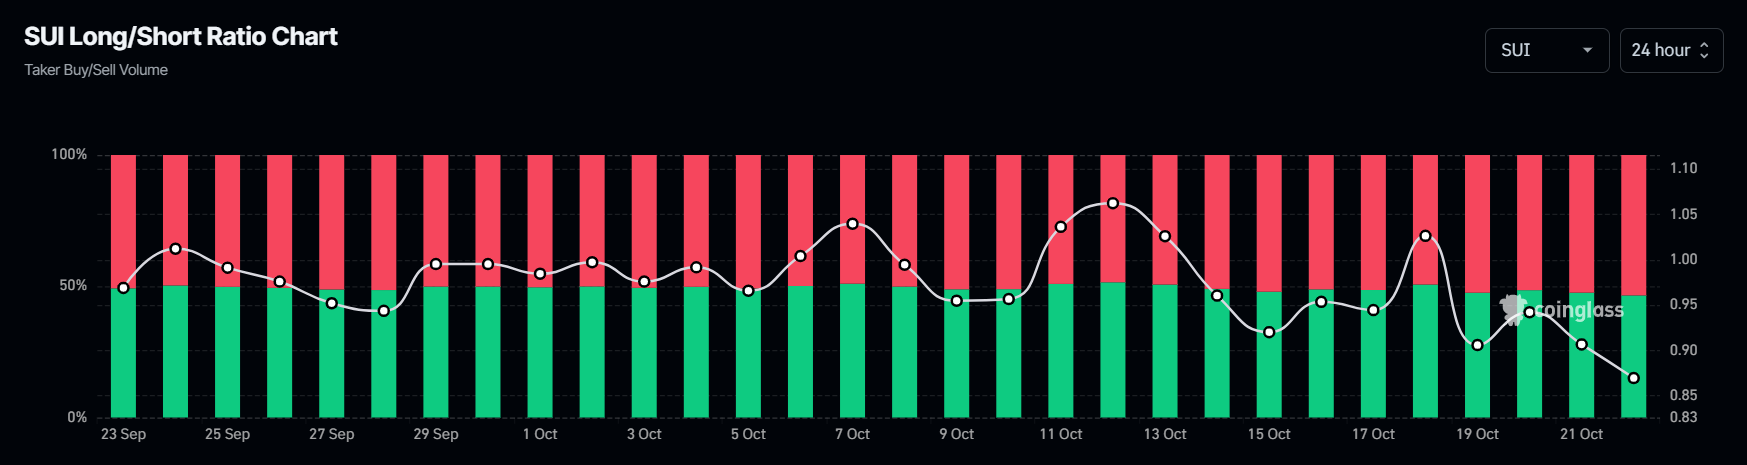
SUI long-to-short ratio chart. Source: Coinglas
Another aspect bolstering the platform’s bearish outlook is a recent decline in traders’ interest and liquidity in the SUI chain. Coinglass data shows that SUI’s daily trading volume declined from $4.02 billion on October 16 to $1.05 billion on Sunday, consistently declining since early October.
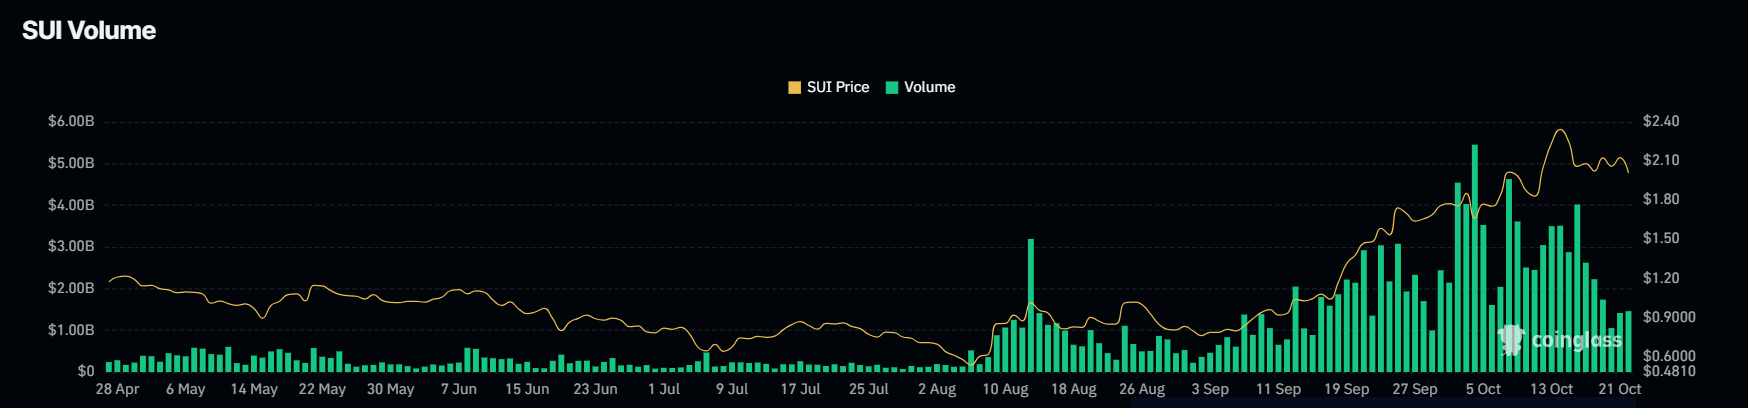
SUI daily trading volume chart. Source: Coinglass
However, the bearish thesis would be invalidated if the Sui price closes above $2.17. This scenario could lead to a rally in Sui’s price to retest its all-time high of $2.36.
Author

Manish Chhetri
FXStreet
Manish Chhetri is a crypto specialist with over four years of experience in the cryptocurrency industry.


