SUI en route to new all-time high following triple-digit rally
- SUI is approaching its all-time high resistance at $2.19 following a 20% rise in the past 24 hours.
- SUI has posted gains of 140% in the past month.
- SUI joins the top seven blockchains by TVL after unicorn milestone, now ranks higher than Avalanche and Polygon.
SUI is up over 20% on Monday and has stretched its monthly gains to 140%, making it one of the best performers among top cryptocurrencies since September 5. The rally has seen many crypto community members drawing similarities between SUI's growth and that of Solana in the altcoin season of the 2021 bull cycle. This article covers the key reasons behind SUI's impressive run.
Why is SUI rising?
The Move-based blockchain's rise follows a series of key integrations, partnerships and launches within its ecosystem, which include:
- After upgrading to the Mysticeti consensus protocol, SUI significantly improved its transaction speed to an alleged 390 milliseconds.
- Circle launched its USDC stablecoin and Cross-Chain Transfer Protocol (CCTP) on the SUI network. As a result, decentralized finance (DeFi) protocols on SUI can leverage the stablecoin to unlock innovative solutions for users.
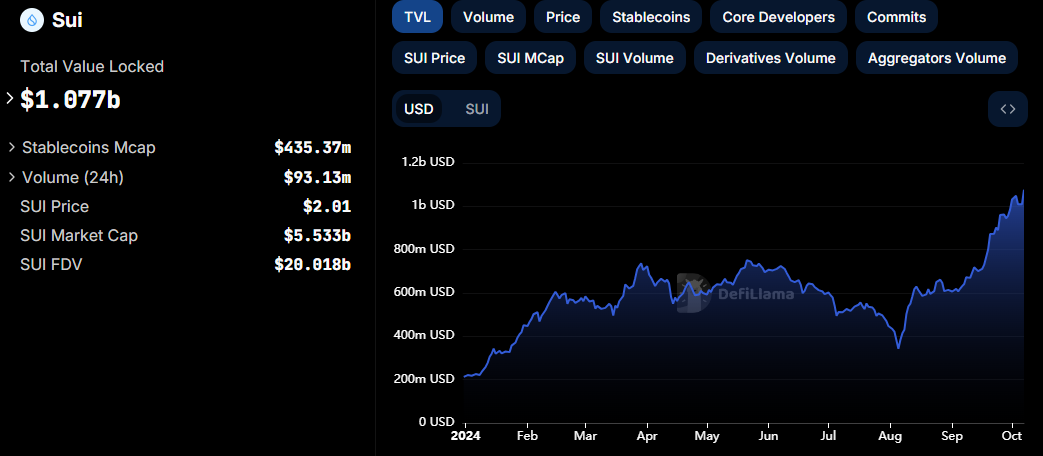
- Total Value Locked (TVL) on SUI is also on a meteoric rise, reaching unicorn levels with a new high of $1.077 billion — above Avalanche and Polygon — per DefiLlama data. SUI's Navi Protocol accounts for the majority of its TVL with a 37% share. A potential reason for Navi's large share of the TVL could be an integration with Alchemy Pay that gives its users access to fiat on/off-ramps.

SUI Total Value Locked (Source: DefiLlama)
- Daily transactions on SUI more than doubled since October 1, rising from 4.3 million to 9 million in the next three days, per Artemis data.
- Grayscale launched a SUI Trust fund in September, offering eligible investors exposure to SUI's price. Marketing efforts from both the Grayscale and SUI teams to promote the fund since its launch demonstrate its importance to both parties.
Despite SUI's impressive performance, investors may need to apply caution due to its inflation rate of 216% in the past year, per Token Unlocks data.
SUI could be on its way to new all-time high
SUI resumed the week with high buying pressure following a price surge above 20% on Monday. The rise comes after SUI bounced off the key support level at $1.611 on Thursday.
With the recent rise, SUI is attempting a rally above its all-time high of $2.19 — a level last seen in March. However, to complete the move, it needs to maintain buying pressure above the $1.96 resistance.
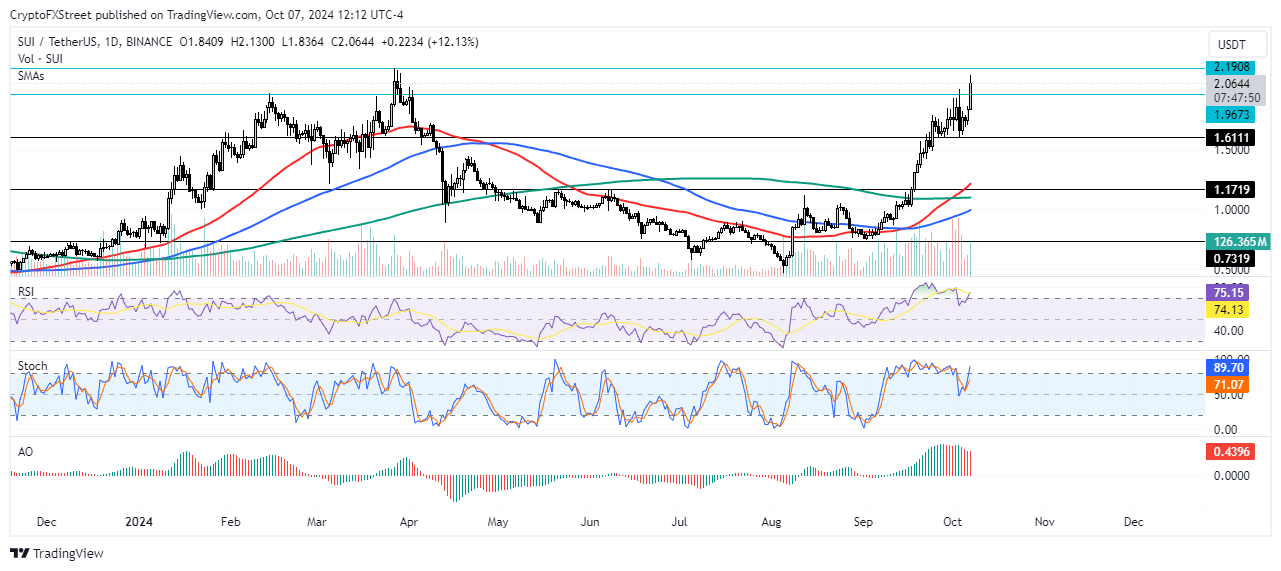
SUI/USDT 4-hour chart
The Relative Strength Index (RSI) and Stochastic Oscillator momentum indicators are in their oversold regions, indicating a potential correction may be imminent. Meanwhile, the Awesome Oscillator is posting long red bars above its neutral level, suggesting the bullish momentum is slowly cooling.
Additionally, according to Coinglass data, SUI's open interest supports the price rally, increasing by over 250% since September 7.
Open interest is the total number of outstanding positions in a derivatives market.
When OI growth outpaces price growth during an uptrend, it signifies a strong bullish bias among investors. Hence, SUI could continue its impressive performance.
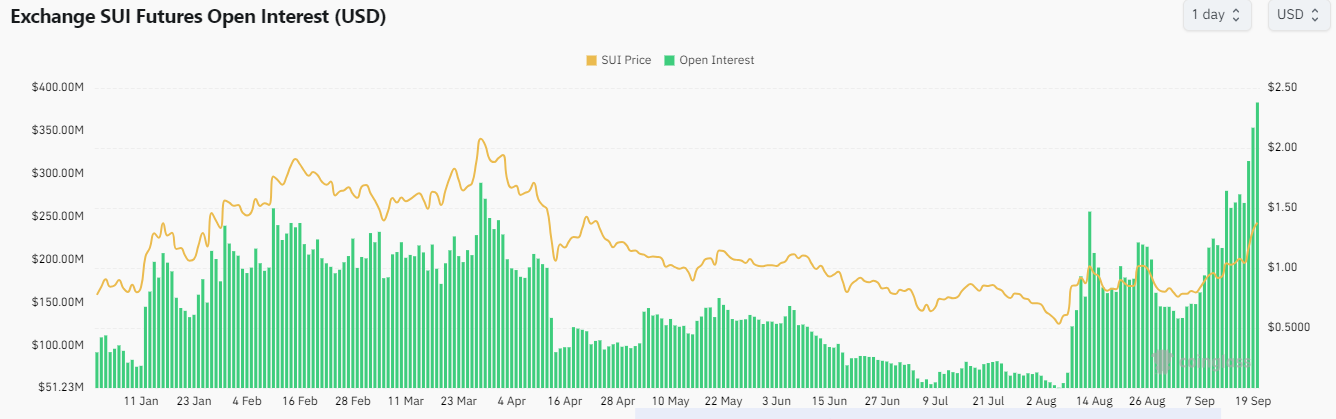
SUI Open Interest (Source: Coinglass)
A daily candlestick close below $1.611 will invalidate the thesis.
Cryptocurrency metrics FAQs
The developer or creator of each cryptocurrency decides on the total number of tokens that can be minted or issued. Only a certain number of these assets can be minted by mining, staking or other mechanisms. This is defined by the algorithm of the underlying blockchain technology. On the other hand, circulating supply can also be decreased via actions such as burning tokens, or mistakenly sending assets to addresses of other incompatible blockchains.
Market capitalization is the result of multiplying the circulating supply of a certain asset by the asset’s current market value.
Trading volume refers to the total number of tokens for a specific asset that has been transacted or exchanged between buyers and sellers within set trading hours, for example, 24 hours. It is used to gauge market sentiment, this metric combines all volumes on centralized exchanges and decentralized exchanges. Increasing trading volume often denotes the demand for a certain asset as more people are buying and selling the cryptocurrency.
Funding rates are a concept designed to encourage traders to take positions and ensure perpetual contract prices match spot markets. It defines a mechanism by exchanges to ensure that future prices and index prices periodic payments regularly converge. When the funding rate is positive, the price of the perpetual contract is higher than the mark price. This means traders who are bullish and have opened long positions pay traders who are in short positions. On the other hand, a negative funding rate means perpetual prices are below the mark price, and hence traders with short positions pay traders who have opened long positions.
Author

Michael Ebiekutan
FXStreet
With a deep passion for web3 technology, he's collaborated with industry-leading brands like Mara, ITAK, and FXStreet in delivering groundbreaking reports on web3's transformative potential across diverse sectors. In addition to


