|

Stellar Price Prediction: XLM on the brink of a 45% collapse, shows technicals

  • Stellar price is contained inside a symmetrical triangle pattern on the 12-hour chart.
  • A key indicator is on the verge of presenting a massive sell signal.
  • XLM bulls must defend $0.361 to avoid a colossal sell-off.

Stellar price already had a significant 50% sell-off from its top of $0.60 but the bears could be eying up even more. There is a lot of downside potential for XLM as several indicators show it could be poised for another leg up.

Stellar price needs to defend this key level to avoid a 45% drop

On the 12-hour chart, Stellar has established a symmetrical triangle pattern with a critical support trendline located at $0.361. A breakdown below this point would push Stellar price down to $0.20, a 45% move calculated using the maximum height of the pattern as a reference point.

xlm price

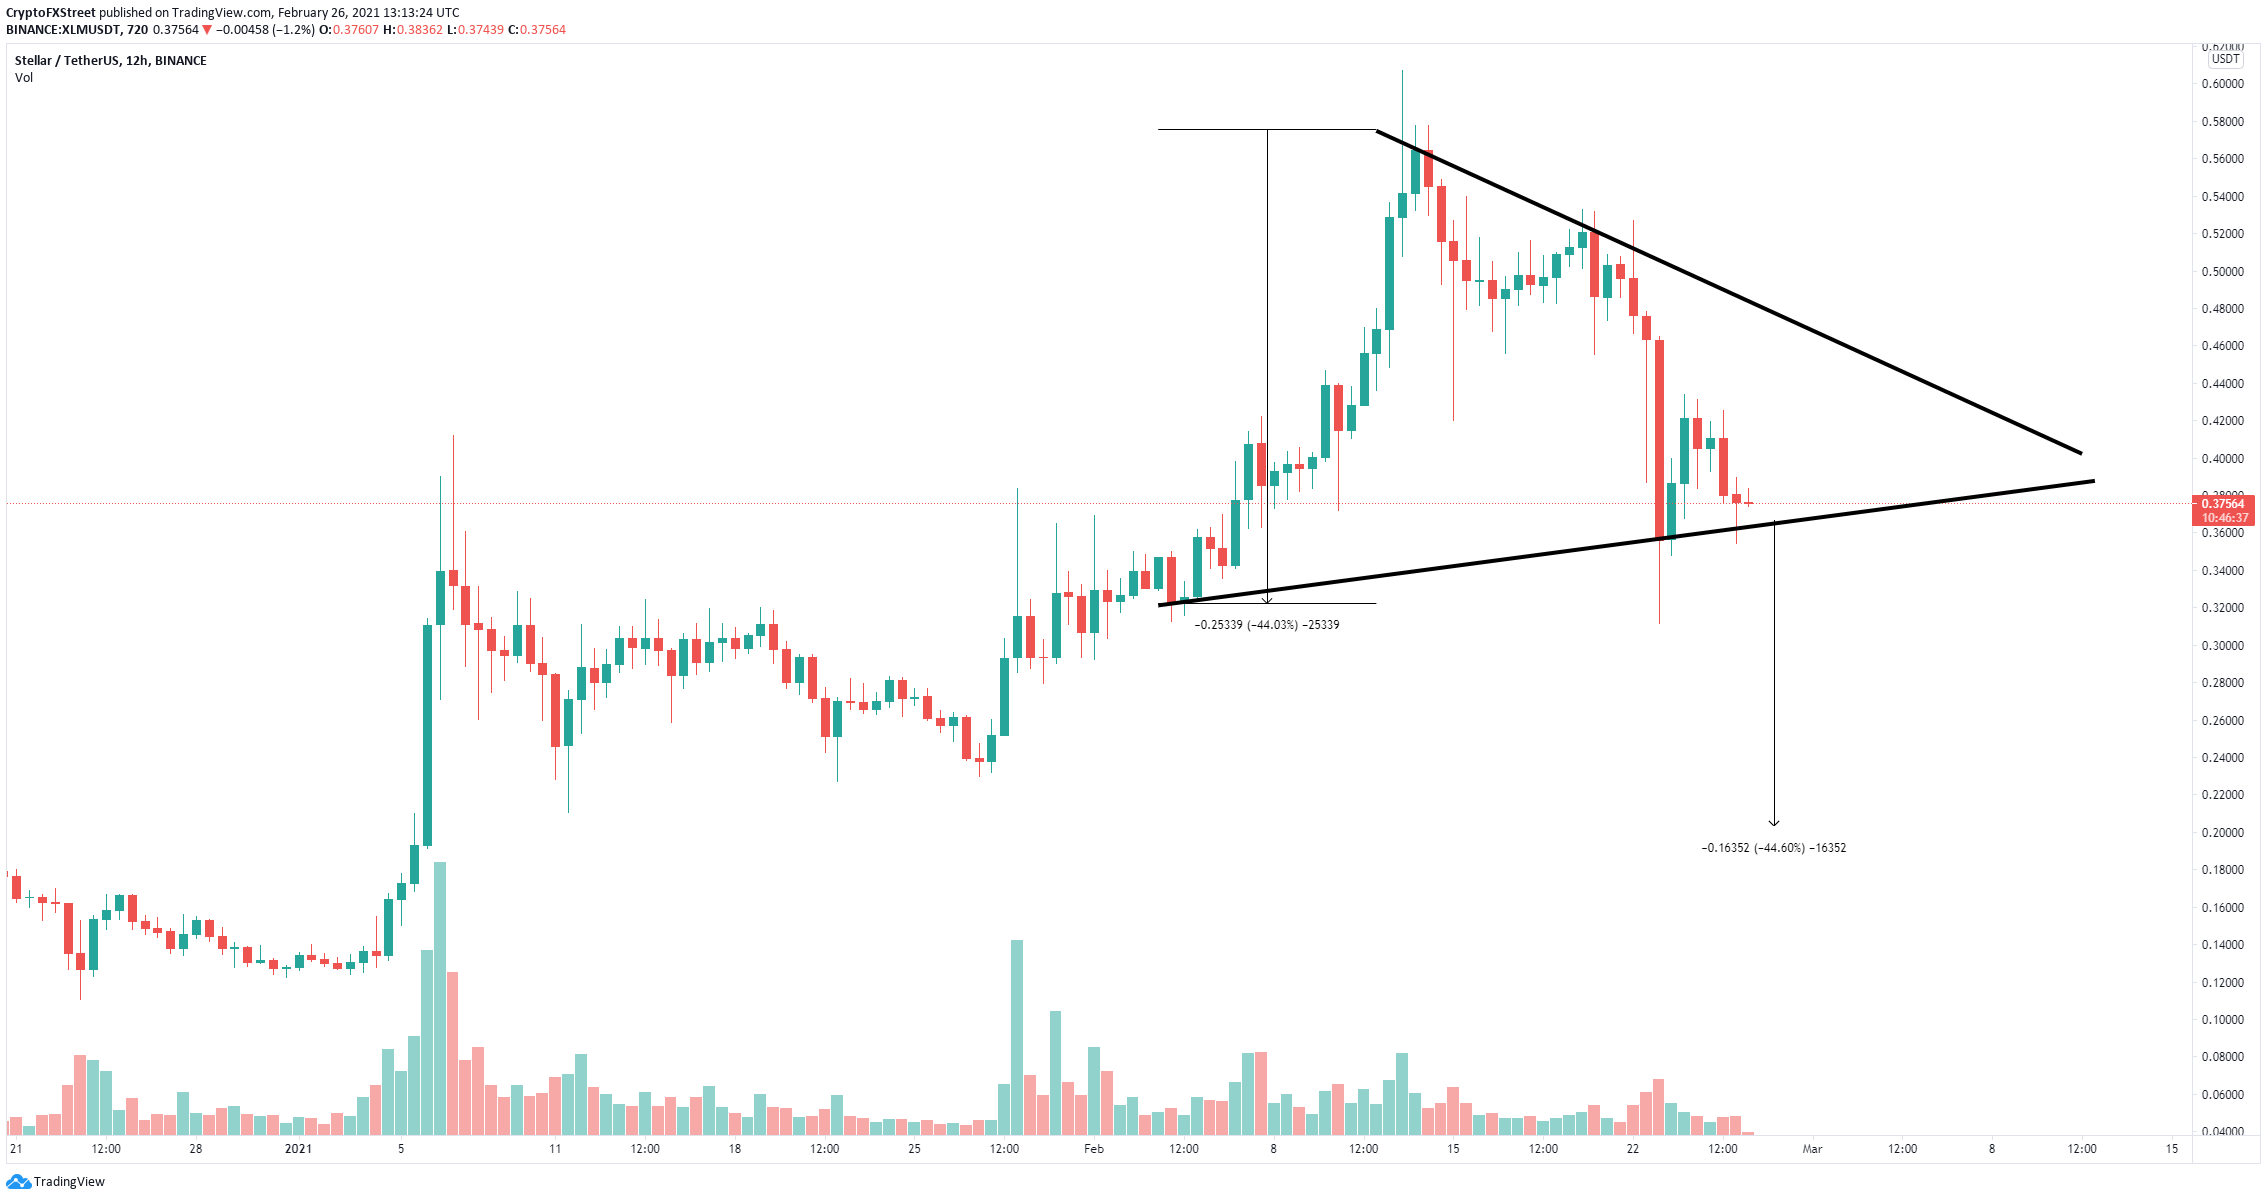
XLM/USD 12-hour chart

Additionally, the TD Sequential indicator has presented a green ‘8’ candlestick on the weekly chart which is usually followed by a sell signal. This call would be significant considering the last one had a lot of bearish continuation.

xlm price

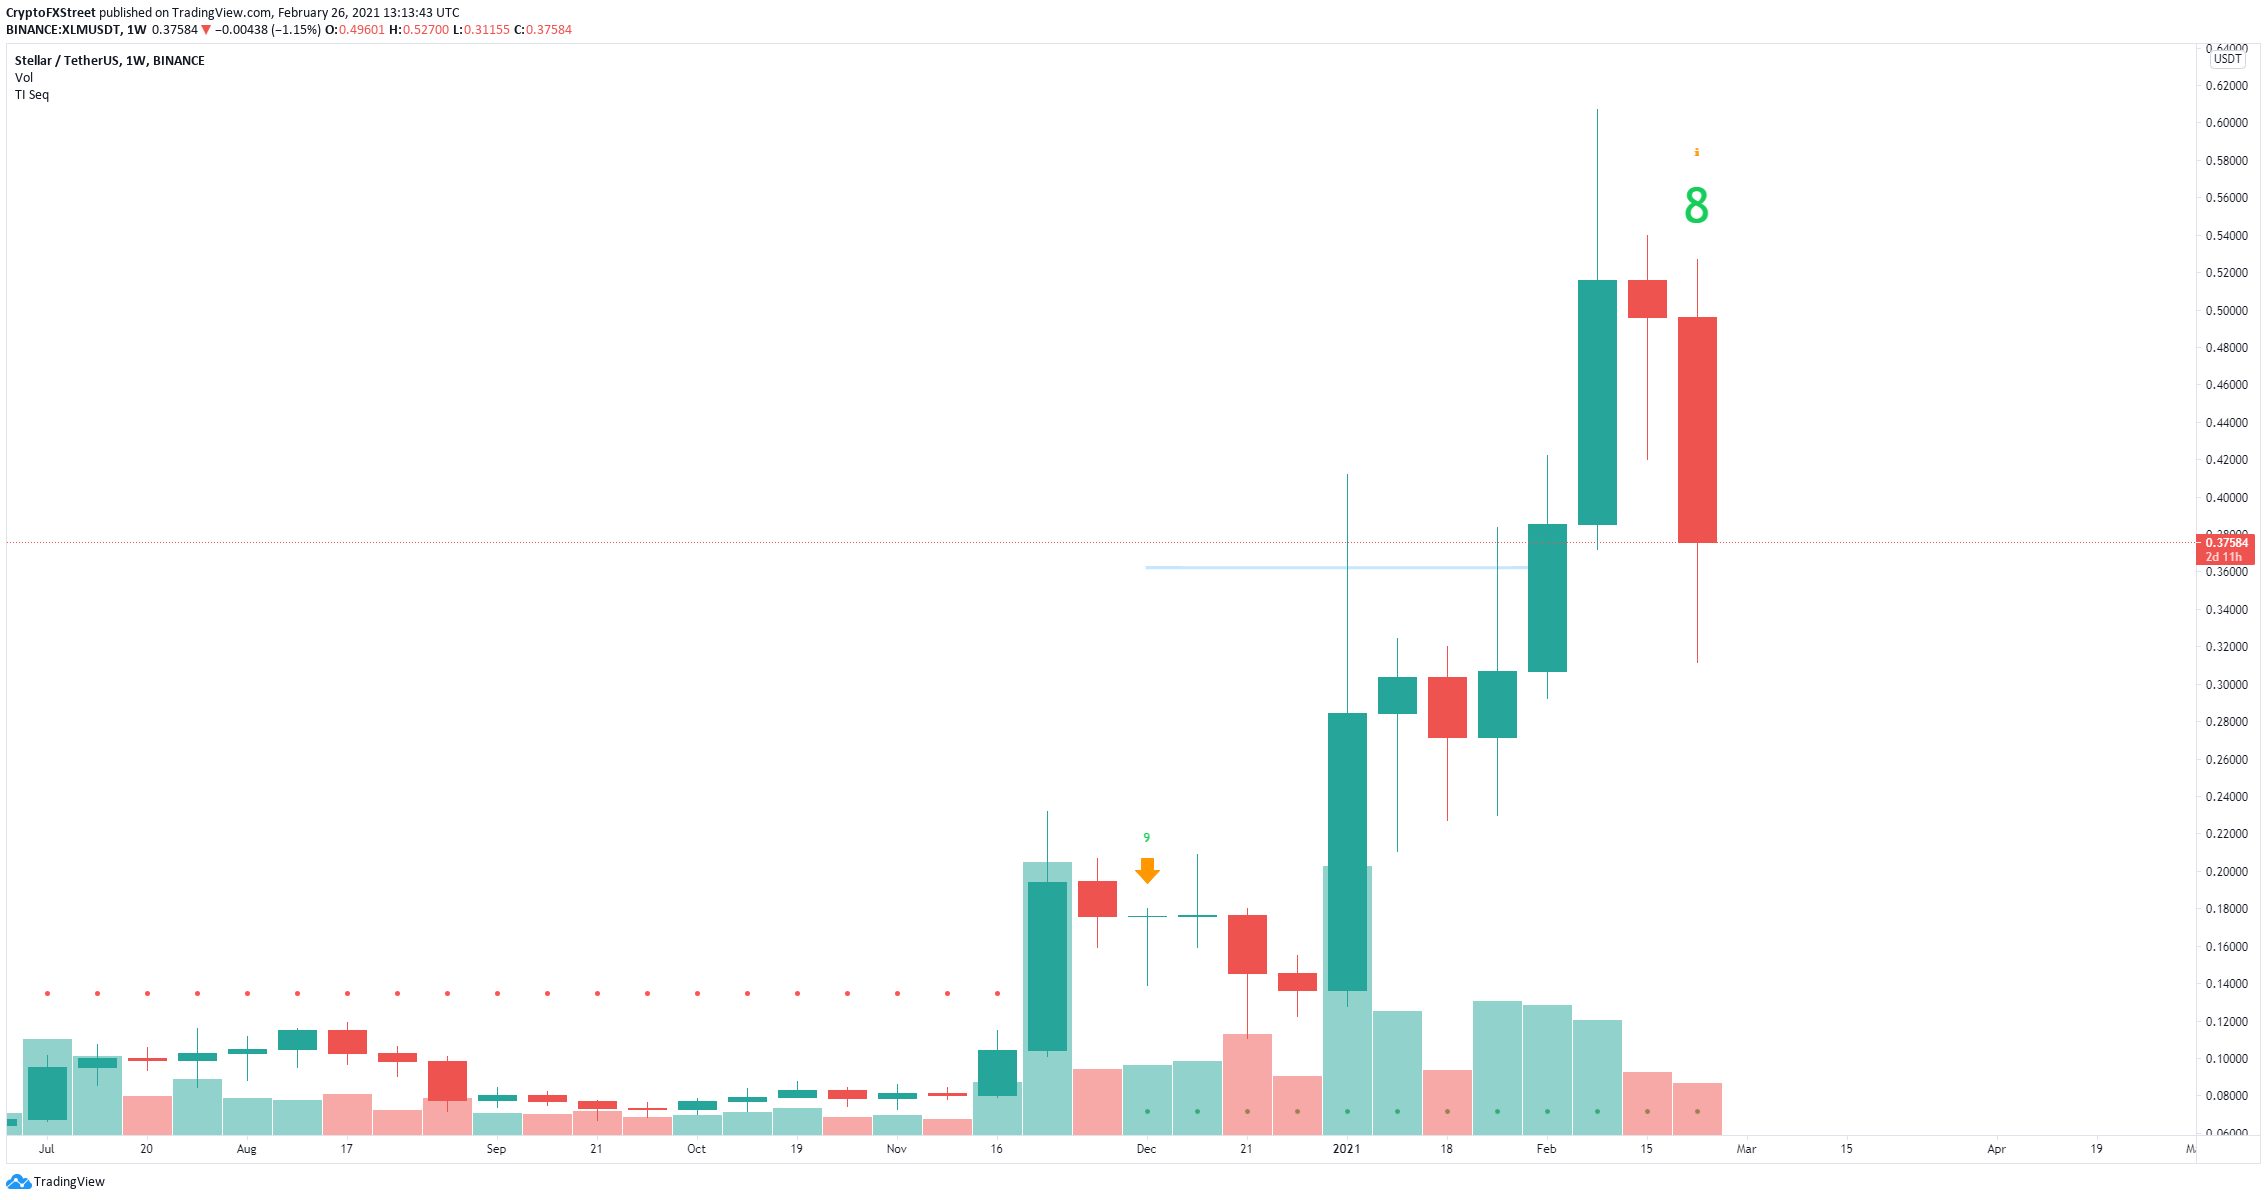
XLM/USD weekly chart

On the flip side, if the bulls can defend $0.361, XLM will aim for a nice rebound towards the upper trendline of the symmetrical triangle at around $0.47.

Author

Lorenzo Stroe

Lorenzo Stroe

Independent Analyst

Lorenzo is an experienced Technical Analyst and Content Writer who has been working in the cryptocurrency industry since 2012. He also has a passion for trading.

More from Lorenzo Stroe
Share:

Editor's Picks

Ripple stabilizes as support holds amid steady ETF inflows

Ripple pares losses and trades around $1.05 at the time of writing on Monday. The cross-border remittance token is attempting a recovery after last week’s sell-off, which intensified as the US and Iran exchanged fire.

Crypto Today: Bitcoin and Ethereum edge higher, XRP pares losses as US and Iran agree to resume talks

Bitcoin is showing renewed signs of recovery, approaching the $60,000 mark at the time of writing on Monday. Among altcoins, Ethereum is positioned for a potential breakout above $1,600, while Ripple continues to face bearish pressure, holding just above the key $1.00 psychological support.

Bitcoin four-year cycle: BTC risks 75% drawdown with four months of bear market still ahead

Bitcoin price continues to trend downward below the $60,000 support zone after losing over 50% of its value since the $126,199 high in October. Bitcoin’s four-year cycle, measured from cycle tops to bottoms, suggests that four months of a bear market are still ahead.

Bitcoin Price Forecast: Mild recovery as US and Iran agree to halt attacks, resume talks

Bitcoin recovers slightly on Monday, trading above $60,000 after closing below the 200-week SMA the previous week. Market sentiment turned cautiously positive after the US and Iran agreed to halt attacks and renew peace talks.

Bitcoin: BTC hits 20-month low, will the pain continue?

Bitcoin has remained under pressure this past week, losing over 5% as traders assess mixed signals from different parties involved in the Middle East conflict.