Stellar price holds at the threshold as bulls prepare for a 14% move
- Stellar price is closing in on an extremely bullish triple-bottom pattern breakout to $0.1250.
- The development of Stellar's new smart contracts platform, Soroban, is at an advanced stage.
- XLMUSD may only achieve the forecasted move to $0.1250 if its on-chain volume keeps diminishing.

Stellar price is in the middle of validating an uptrend in the wake of its freefall from an extremely stubborn resistance at $0.1158. The cross-border money remittance token dodders at $0.1099 at the time of writing as bulls push for a move above the hurdle, as mentioned earlier.
Stellar releases update on the new smart contracts platform
The Stellar Development Foundation is developing a new smart contracts platform referred to as Soroban. According to the communication sent via Twitter on Wednesday, Soroban has been designed to enhance scalability for reliable access to finance rails. Users can quickly connect smart contracts to "Stellar's unparalleled on/off ramps."
Soroban will bridge developers and new audiences, with the latter having unmatched access to financial instruments. The foundation reckons that the platform's development has been fast-tracked, with Soroban expected to launch on the mainnet in the second quarter of 2023.
"We're moving faster on this than we ever have with anything else before," says @jricetweets about the development of Soroban, the new smart contract platform built on Stellar.
— Stellar (@StellarOrg) November 2, 2022
Check out what's coming next and how you can contribute: https://t.co/liIUjYruf4 pic.twitter.com/gf48eOeXCe
Smart contracts features have been known to elevate the status of crypto projects in the industry. Therefore, Stellar's position as a financial services platform will benefit immensely from the launch of Soroban. The blockchain's native token XLM is bound to increase in value owing to a potential increase in demand from users and developers.
The Stellar Development Foundation will likely go the extra mile and add a staking function, making XLM a highly competitive token.
Stellar price could validate a triple-bottom pattern
Stellar price has, since mid-October, danced between two unwavering support and resistance levels, resulting in the formation of a triple-bottom pattern, as shown in the chart below. This pattern is created by three relatively equal lows that should ideally lead to a break above resistance.
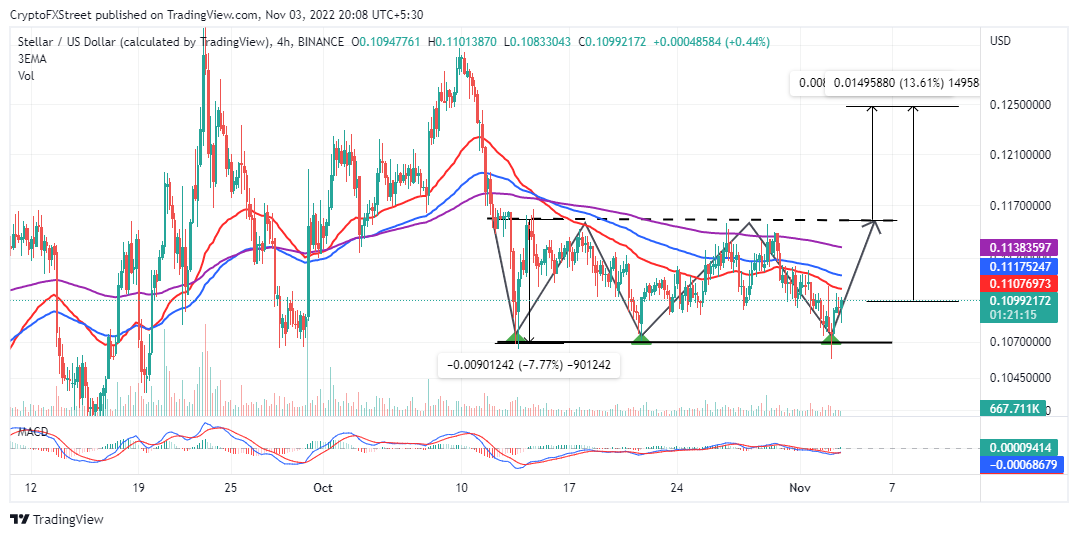
XLM/USD four-hour chart
The triple bottom is a highly bullish pattern that appears toward the tail end of a downtrend, like in XLM's case. As selling pressure weakens, increasing demand for the asset fuels a big bullish move – crowned by a break above the horizontal (neckline) resistance at $0.1158.
While triple-bottom patterns can be extremely rewarding, traders must wait for the price to break above the neckline resistance before going into long positions.
XLM could move 14% above its current market price, but the triple bottom will validate a 7.75% move from the neckline. This target equals the pattern's height and is drawn from XLM's potential breakout point at $0.1158.
It is important to treat the triple-bottom as a neutral chart pattern – without a bullish or bearish bias until it breaks above the resistance. For that reason, Stellar price is not out of the woods yet and could also drop 7.75% below the pattern's support, thus validating a downtrend.
Author

John Isige
FXStreet
John Isige is a seasoned cryptocurrency journalist and markets analyst committed to delivering high-quality, actionable insights tailored to traders, investors, and crypto enthusiasts. He enjoys deep dives into emerging Web3 tren




