|

Stellar Price Prediction: XLM needs to hold a crucial support level to avoid slipping to $0.06

  • XLM is trading at $0.072 holding a critical level in the form of the 100-SMA on the daily chart
  • Stellar is down more than 60% from its peak at $0.1194.

XLM had a great 2020, from a low at $0.026 on March 12, to a peak at $0.1194. Bulls need to defend a critical support level in order to avoid further losses.

XLM/USD 3-day chart

xlm price

The 100-SMA at $0.069 is the most important support level. It was defended twice on September 21 and 30. A bearish breakout below this level would take the digital asset down to $0.06. 

XLM/USD daily chart
xlm price

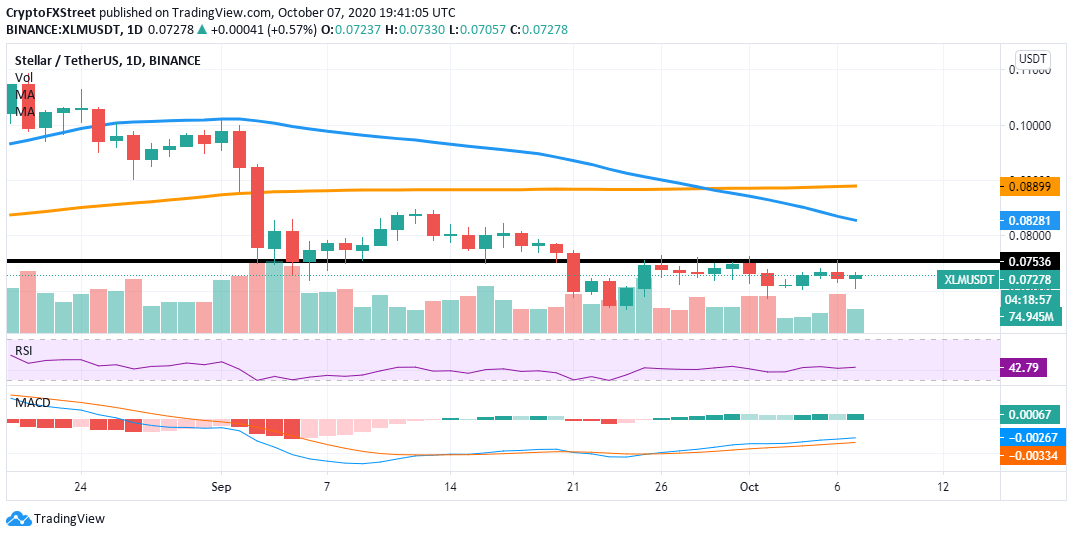
XLM is facing a resistance level at $0.075 that has rejected the price several times during the past two weeks. The 50-SMA and the 100-SMA have crossed bearishly and will act as resistance levels. 

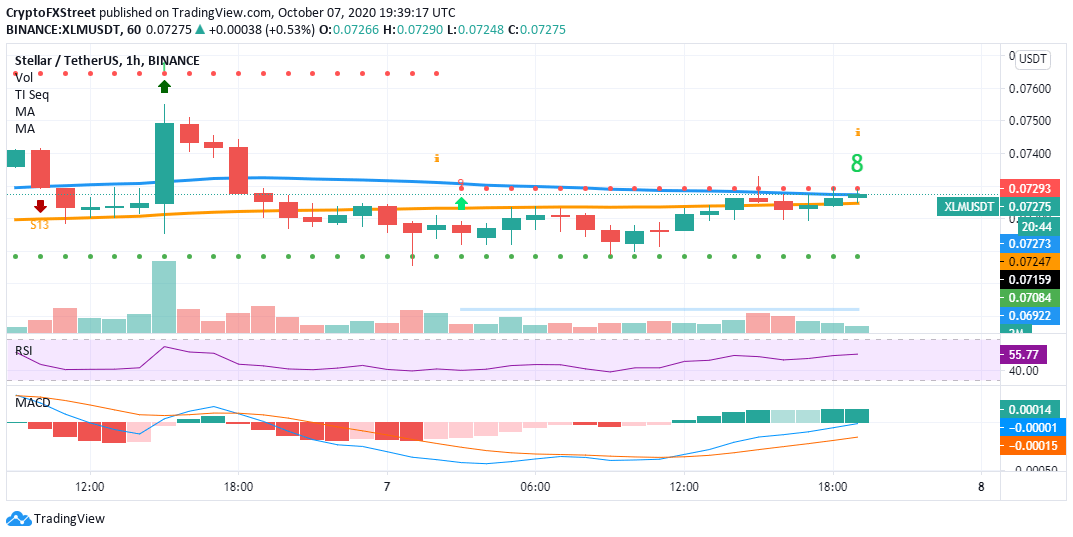
The Bollinger bands are squeezing, which indicates a major move is underway, so far favoring the bears. Furthermore, the 1-hour chart is also in favor of the sellers. The TD sequential indicator is close to presenting a sell signal after posting a green ‘8’.

XLM/USD 1-hour chart
xlm price

On the other hand, XLM is trading above the 100-SMA and the 50-SMA on the 1-hour chart, turning both into support levels. The MACD has been bullish since this morning and could help the price close above the 50-SMA.

A breakout above the $0.075 resistance level on the daily chart could take XLM up to the 50-SMA at $0.082. 

Sellers need to pay close attention to the 100-SMA on the 3-day chart as the most critical support level. A bearish breakout can drop the price towards $0.06. 

Author

Lorenzo Stroe

Lorenzo Stroe

Independent Analyst

Lorenzo is an experienced Technical Analyst and Content Writer who has been working in the cryptocurrency industry since 2012. He also has a passion for trading.

More from Lorenzo Stroe
Share:

Editor's Picks

XRP retreats as ETF interest cools
Ripple (XRP) slides toward the short-term $1.10 support on Friday, as broader crypto market sentiment weighs on crypto assets. The sell-off mainly stems from fears of inflation in the United States (US) amid the ongoing war in the Middle East and rising Oil prices.
Crypto Today: Bitcoin, Ethereum, XRP pare losses as breakout potential builds
Bitcoin (BTC) is edging higher on Friday, albeit gradually, after reclaiming support above $65,000. Meanwhile, Ethereum (ETH) shows signs of stability near the immediate $1,900 hurdle, backed by mild capital inflows. Ripple (XRP), on the other hand, holds above the pivotal $1.10, with its upside structurally constrained below $1.15.
Bitcoin Weekly Forecast: BTC holds firm, but the $100 Oil threat could change the game
Bitcoin (BTC) is modestly recovering, trading at $65,400 on Friday and holding firmly above the key support zone. US-listed spot Bitcoin Exchange Traded Funds (ETFs) supported BTC’s modest recovery as they continued to attract institutional inflows through Thursday, pointing to the third consecutive week of inflows.
Crypto shrugs off a stronger Dollar
Cryptocurrencies have been affected by jitters in traditional financial markets, losing 0.8% of their market capitalisation over the past 24 hours to $2.23T, dipping to a low of $2.21T at the start of active trading in Asia.
Bitcoin: BTC holds firm, but the $100 Oil threat could change the game
Bitcoin (BTC) is modestly recovering, trading at $65,400 on Friday and holding firmly above the key support zone. US-listed spot Bitcoin Exchange Traded Funds (ETFs) supported BTC’s modest recovery as they continued to attract institutional inflows through Thursday, pointing to the third consecutive week of inflows.

