Stacks price poised for a rally after breaking out of falling wedge pattern
- Stacks broke above a falling wedge pattern on Wednesday, suggesting a bullish move.
- On-chain data shows open interest is rising, signaling new or additional money in STX.
- A daily candle stick close below $1.127 would invalidate the bullish thesis.
Stacks (STX) broke above a falling wedge pattern on Wednesday, sugesting a bullish move ahead. As of Thursday, it is currently trading 9% higher at $1.664 at the time of writing. On-chain data indicates that open interest is increasing, signaling new or additional capital entering the market, potentially paving the way for a rally in the coming days.
Stacks price sets for 18% rally
STX price retested the support area between $1.297 and $1.127 and bounced on Monday, breaking above the falling wedge pattern on Wednesday. At the time of writing, it trades 9% up to $1.664 on Thursday.
If the upper trendline of the wedge pattern supports a pullback, STX could rally 18% to retest its June 16 high of $1.969.
The Relative Strength Index (RSI) indicator in the daily chart is breaking above the neutral level of 50, while the Awesome Oscillator (AO) is on its way to doing the same. If bulls are indeed making a comeback, then both momentum indicators must maintain their positions above their respective mean levels. Such a development would add a tailwind to the recovery rally.
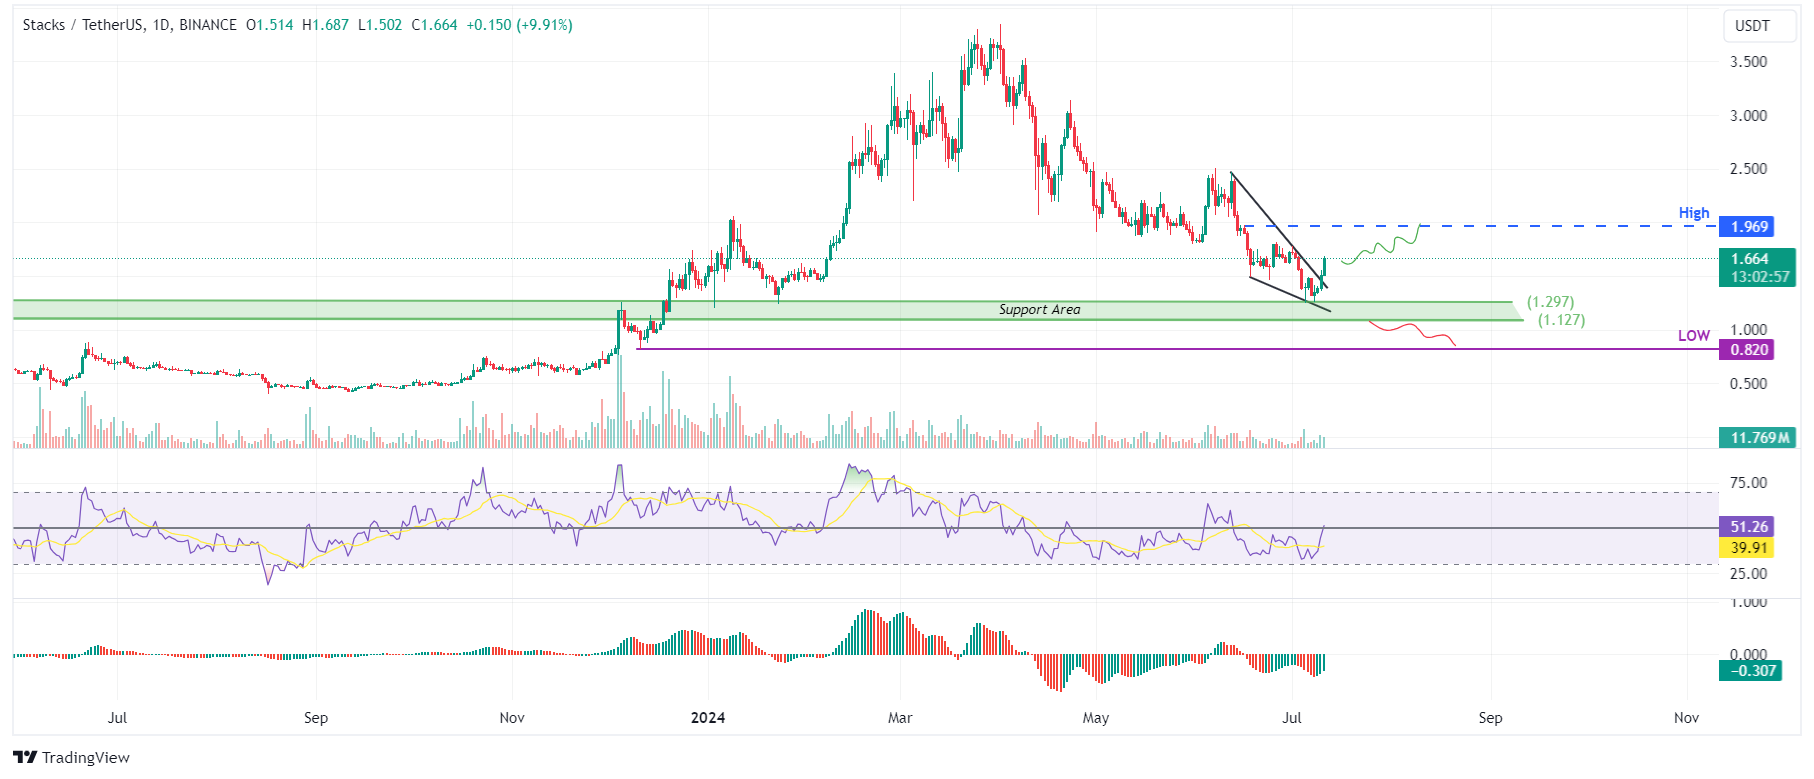
STX/USDT daily chart
Data from CoinGlass shows that the future's Open Interest (OI) in STX at exchanges is increasing. The OI indicates the total number of outstanding derivative contracts that have not been settled (offset by delivery) and whether money flows into the contract are increasing or decreasing.
Increasing OI represents new or additional money coming into the market and new buying happening, which is a bullish trend. When OI decreases, it is usually a sign that the market is liquidating, more investors are leaving, and the current price trend is ending.
As shown in the graph below, STX's OI increased from $37.34 million on Tuesday to $79.15 million on Thursday, indicating that new or additional money is entering the market and new buying is occurring.
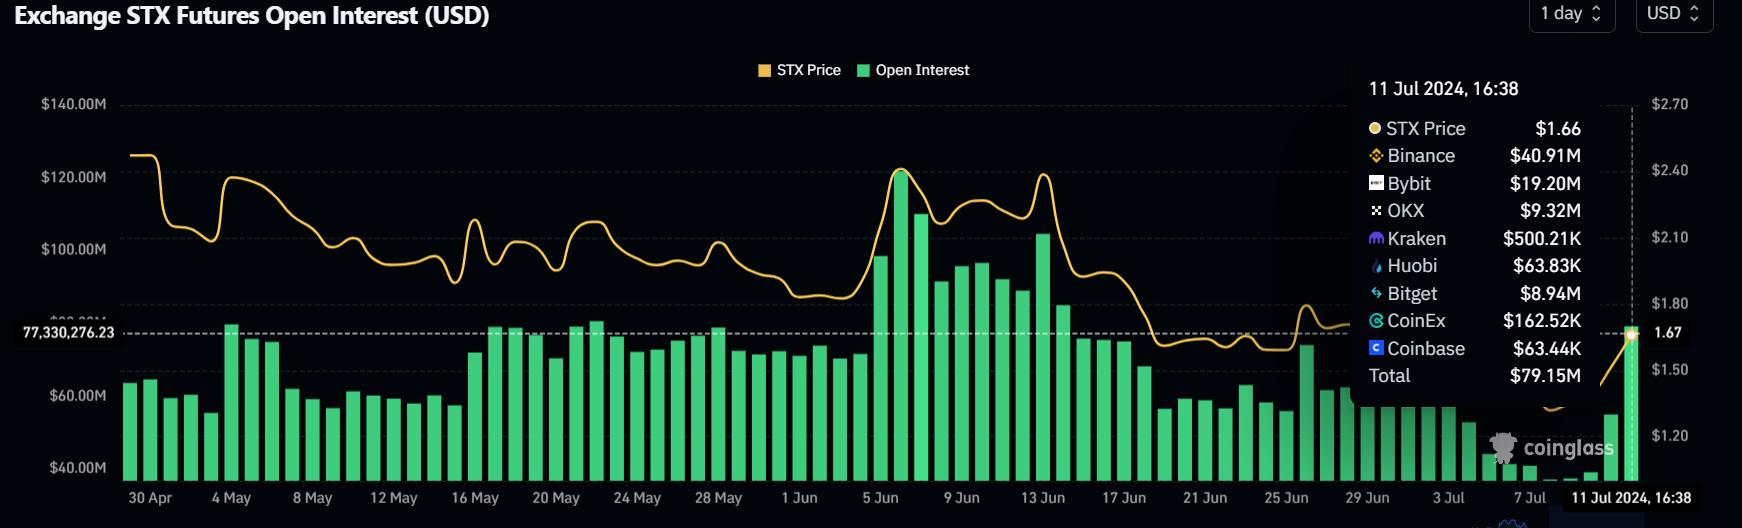
STX Open Interest chart
Even though the on-chain metric and technical analysis point to a bullish outlook, if STX’s daily candlestick closes below $1.127, the lower boundary of the support area, the bullish thesis would be invalidated by producing a lower low on the daily timeframe. This development may trigger a 27% decline in Stacks's price to revisit the December 11, 2023, low of $0.820.
Author

Manish Chhetri
FXStreet
Manish Chhetri is a crypto specialist with over four years of experience in the cryptocurrency industry.


