Top 3 Price Prediction Bitcoin, Ethereum, Ripple: Bitcoin eyes upside move on bullish technicals
- Bitcoin price action shows a bullish divergence on the momentum indicators, signaling a bullish move.
- Ethereum finds support around the key level at $2,817, with an impending rally eyed.
- Ripple price finds support around the weekly support level of $0.413, with potential recovery on the cards.

Bitcoin (BTC) price action indicates a bullish signal from the Relative Strength Index (RSI) and the Awesome Oscillator (AO) indicators, foretelling an upward trend. Ethereum (ETH) and Ripple (XRP) are mirroring Bitcoin's path, finding stability at critical levels and suggesting potential price increases shortly.
Bitcoin price looks promising as technical indicators show bullish divergence
Bitcoin price encountered resistance at the weekly resistance level of $58,375 in the past four days and trades below it around $57,810, 0.56% down on Wednesday.
Additionally, the formation of a lower low in the daily chart on July 5 contrasts with the Relative Strength Index's (RSI) higher high during the same period. This development is termed a bullish divergence and often leads to the reversal of the trend or a short-term rally.
If BTC closes above the $58,375 weekly resistance level, it could rise 9% to revisit the daily resistance at $63,956.
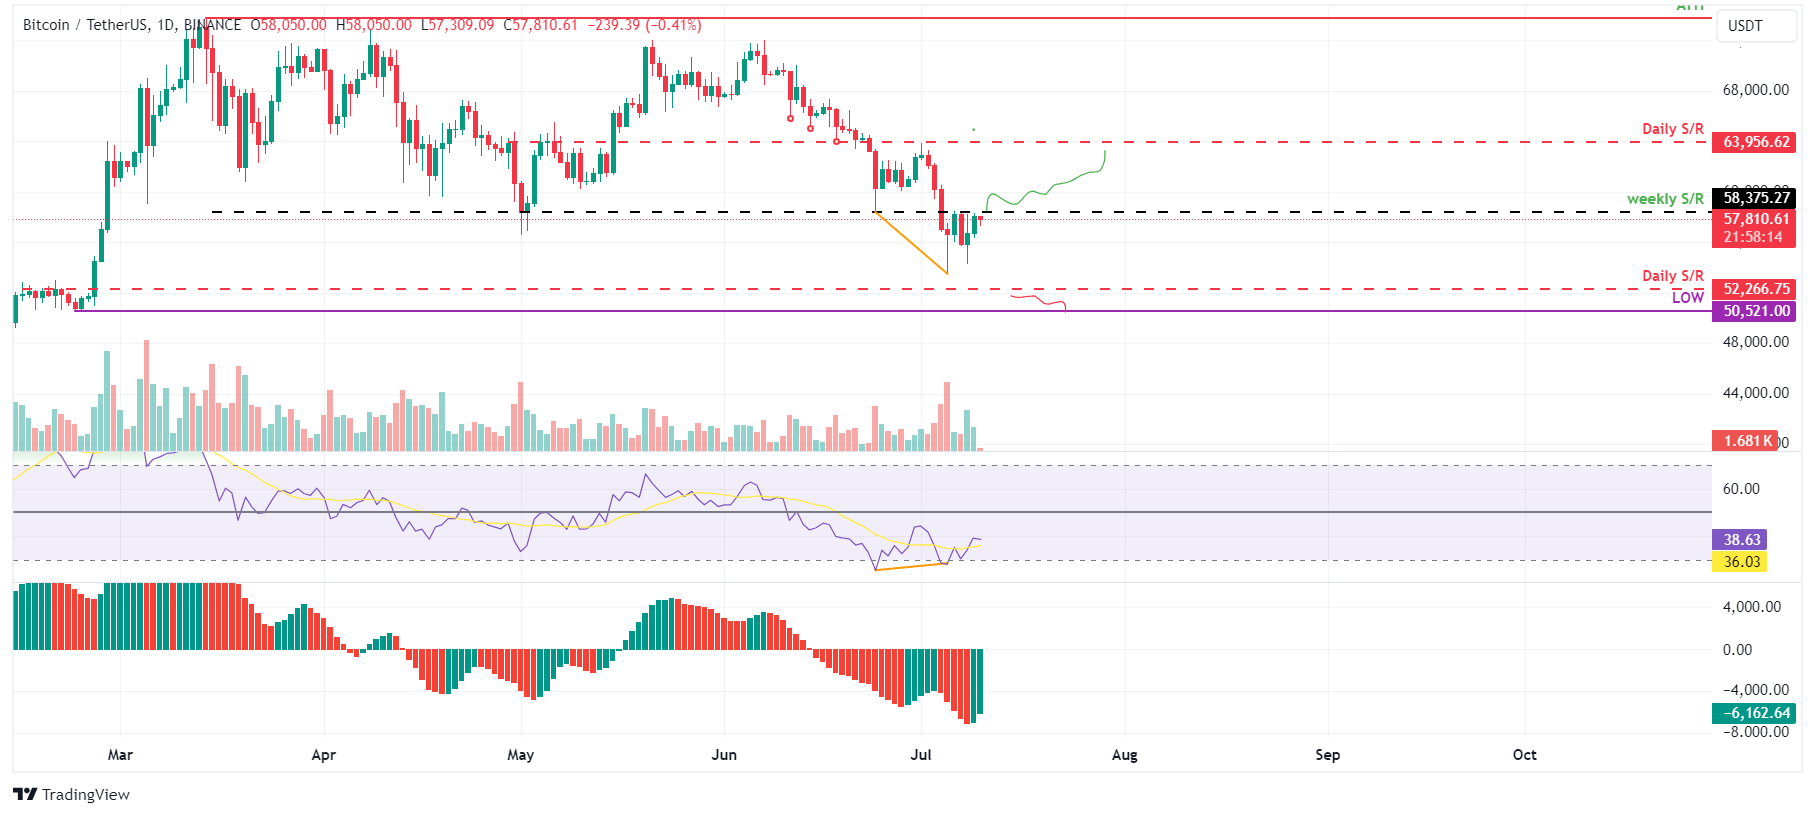
BTC/USDT daily chart
However, if BTC closes below the $52,266 daily support level and forms a lower low in the daily time frame, it could indicate that bearish sentiment persists. Such a development may trigger a 4% decline in Bitcoin's price to revisit its daily low of $50,521 from February 23.
Ethereum price eyes rally following support retest
Ethereum price found support on Monday at the $2,817 low of May 1, bouncing 1.58% the next day. At the time of writing, it trades 0.49% down at $3,059 on Wednesday.
If ETH closes above the $3,240 level, it could rise 8.8% to retest its daily high from July 1 at $3,524.
The Relative Strength Index (RSI) and the Awesome Oscillator (AO) on the daily chart are below their respective neutral levels of 50 and zero. For bulls to sustain momentum, both indicators must rise above these critical levels, potentially supporting the ongoing recovery rally.
Additionally, if ETH closes above the $3,240 level, it could extend an additional rise of 5.5% to retest its next daily high at $3,717 from June 9.
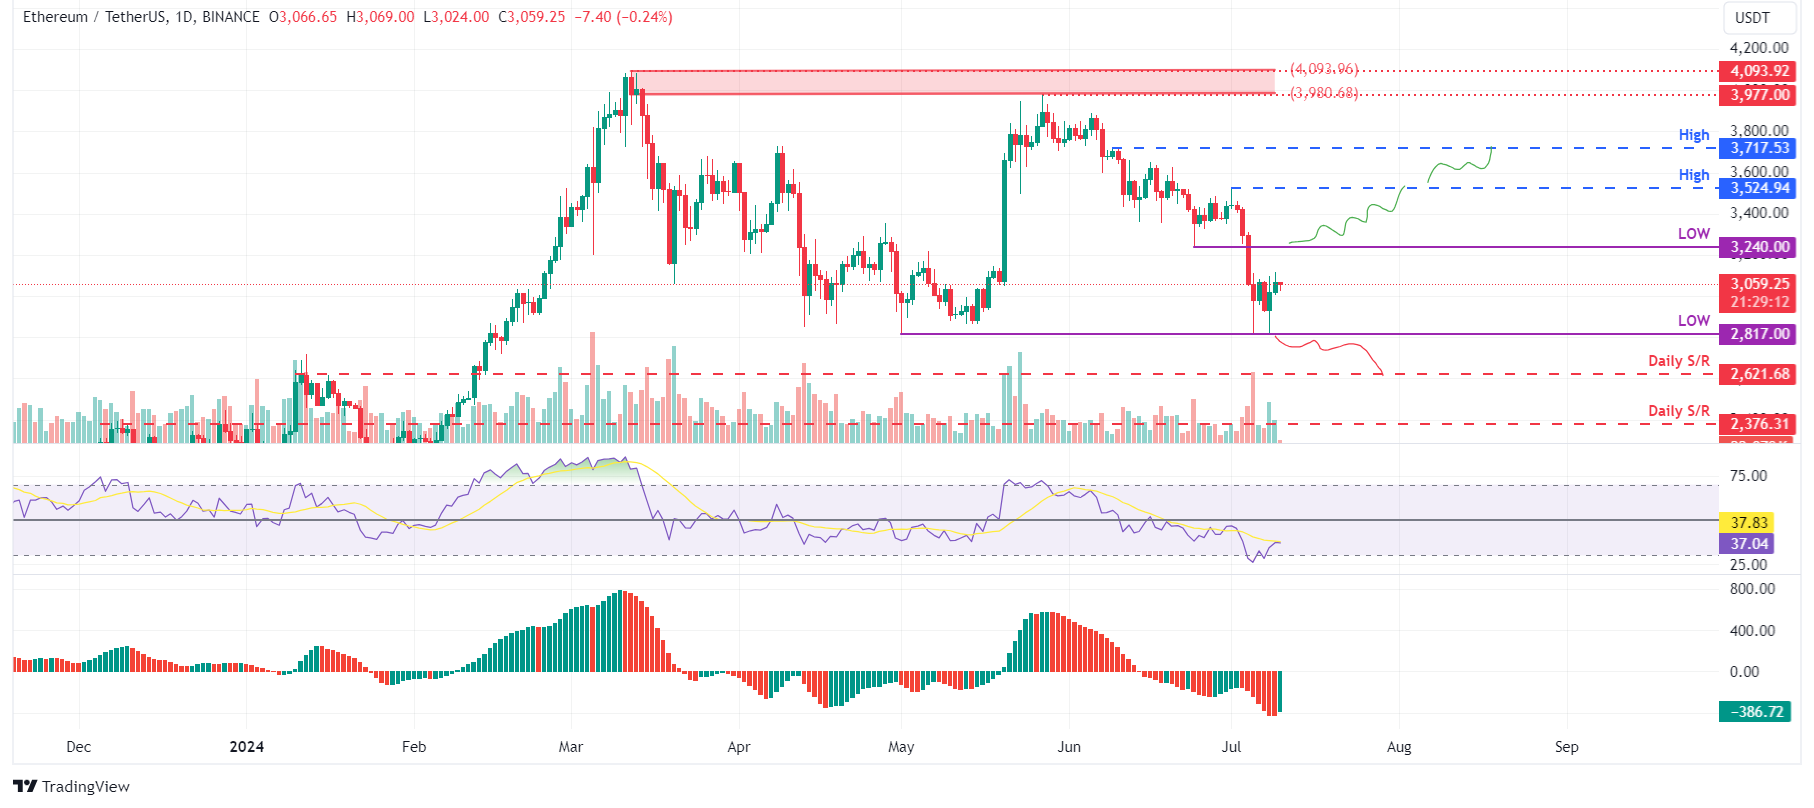
ETH/USDT daily chart
On the other hand, if Ethereum's daily candlestick price closes below $2,817, forming a lower low in the daily time frame, it could indicate that bearish sentiment persists. Such a development may trigger a 7% decline in Ethereum's price to revisit its daily support at $2,621.
Ripple price shows potential recovery rally
Ripple price found support around the weekly level of $0.413 on Monday and bounced 1% the next day. At the time of writing, it trades 0.2% down at $0.434 on Wednesday.
If XRP’s daily close above the $0.450 level, it could rally 11% to revisit its daily resistance at $0.499.
The Relative Strength Index (RSI) and the Awesome Oscillator (AO) on the daily chart are below their respective neutral levels of 50 and zero. For bulls to sustain momentum, both indicators must rise above these critical levels, potentially supporting the ongoing recovery rally.
Additionally, if XRP closes below the $0.499 level, it could extend an additional rise of 6.4% to retest its next daily high at $0.532 from June 5.
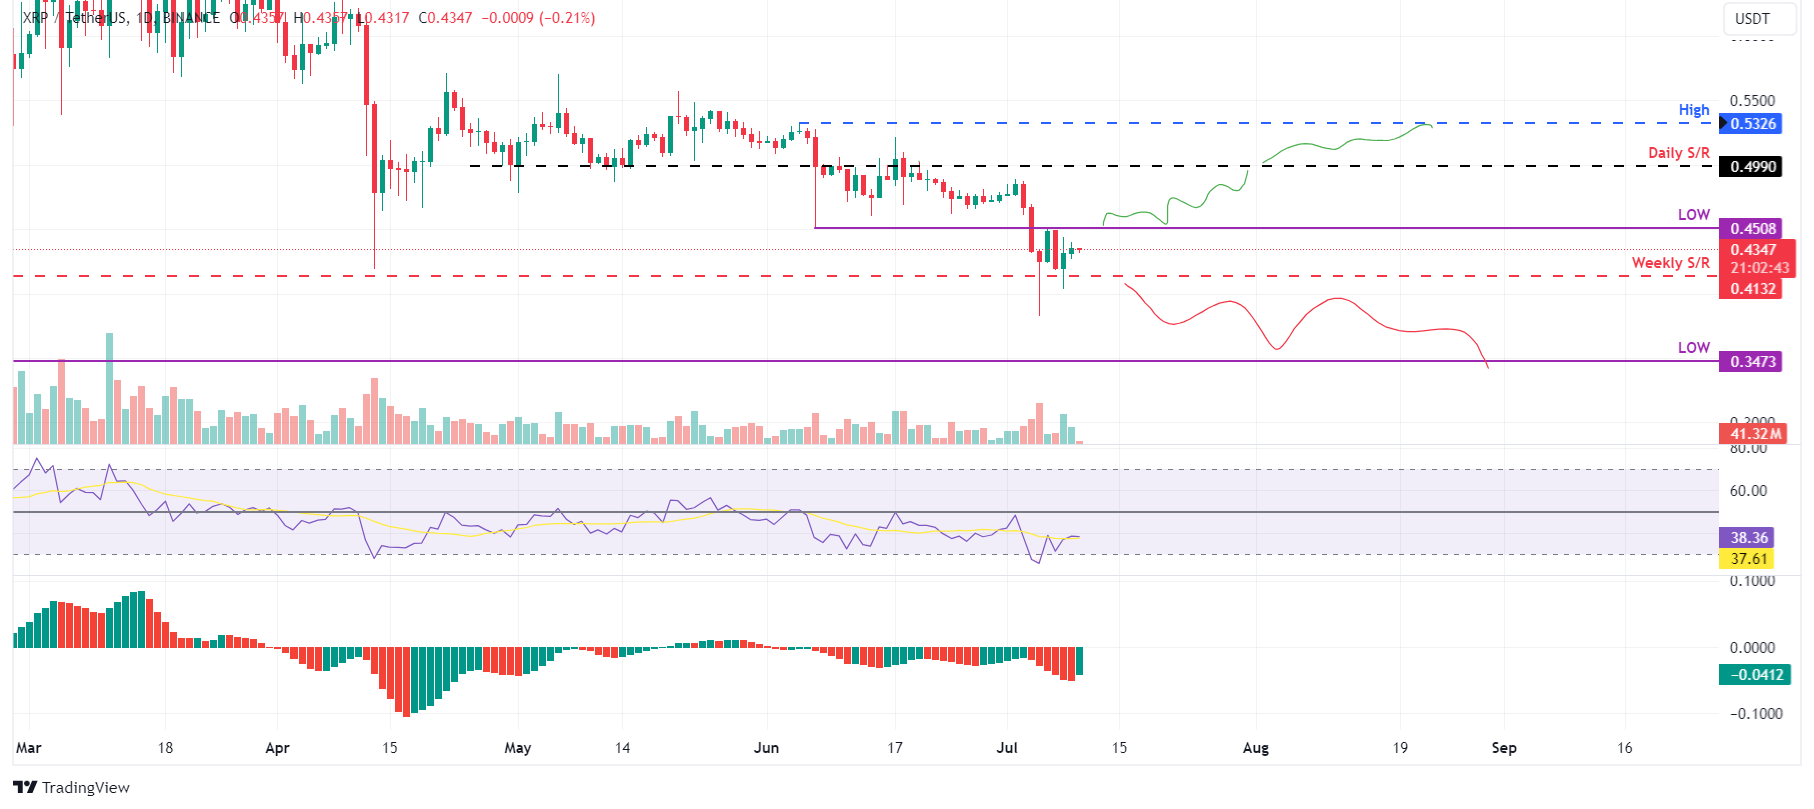
XRP/USDT daily chart
Conversely, if the Ripple price daily candlestick closes below $0.413 and forms a lower daily low, it could indicate that bearish sentiment persists. Such a development may trigger a 16% crash in Ripple's price to revisit its low of March 12 at $0.347.
Author

Manish Chhetri
FXStreet
Manish Chhetri is a crypto specialist with over four years of experience in the cryptocurrency industry.


