|

Solana tests resistance again, bulls push SOL towards $125

  • Solana price was rejected near the $110 resistance zone but quickly recovered to test it again.
  • Some short sellers may be trapped if bulls can rally SOL into the prior bull flag.
  • Downside pressure remains.

Solana price action has had its whipsaws this week, more so than most high market cap cryptocurrencies. However, buyers appear undeterred this week as they make another run at the $110 resistance level despite some negative news and fundamentals.

Solana price bulls look for a breakout above $110 to test $125

Solana price action on Wednesday and Thursday looked like a very strong probability of a bearish continuation occurring. There were many good reasons to bet on that happening for bulls and bears who thought that Solana would dip lower. One of the primary reasons was the hidden bearish divergence while SOL was trading against a critical resistance level.

Many new short positions were added on derivatives exchanges which are now likely feeling the squeeze as Solana has returned to that critical $110 zone. If bulls wish to position Solana to initiate a new bull run, then a daily close at or above $120 is necessary.

A close above $120 means that Solana price closed above the Kijun-Sen, 38.2% Fibonacci retracement, prior 100% Fibonacci expansion, and the bottom trendline of a former bull flag. Additionally, a close at $120 would invalidate the current hidden bearish divergence that may continue to weigh on Solana price.
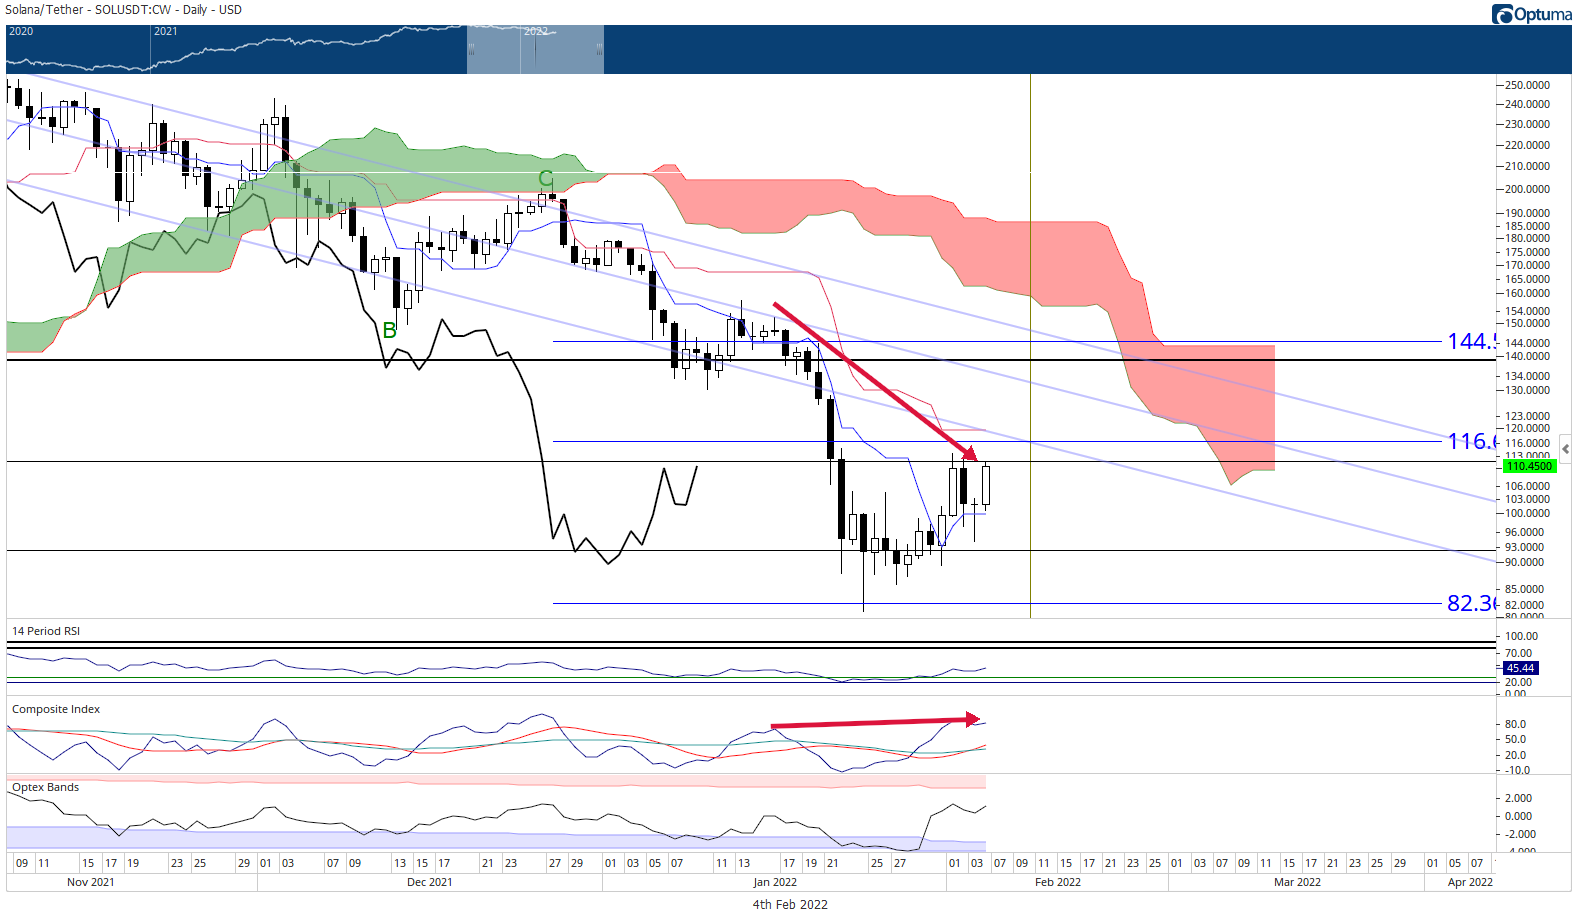
SOL/USDT Daily Ichimoku Kinko Hyo Chart

If bulls fail to push Solana to $120, the recent retest of $110 could be a bull trap and the final retest before a push toward the $75 zone begins.

Author

Jonathan Morgan

Jonathan Morgan

Independent Analyst

Jonathan has been working as an Independent future, forex, and cryptocurrency trader and analyst for 8 years. He also has been writing for the past 5 years.

More from Jonathan Morgan
Share:

Editor's Picks

Bitcoin Weekly Forecast: BTC retreats as macro headwinds grow
Bitcoin (BTC) remains under pressure, down over 4% this week and trading around $76,900 at the time of writing on Friday. Institutional demand shows signs of weakness as spot BTC Exchange Traded Funds (ETFs) are on track to end their three-week inflow streak, recording nearly $500 million in net outflows through Thursday.
XRP falls toward key support as macro uncertainty, weak momentum cap recovery
Ripple (XRP) falls below $1.33 on Friday, marking the third consecutive day of declines. The token continues to track the broader cryptocurrency market downturn, with investors closely monitoring heightened macroeconomic uncertainty ahead of the United States (US) Consumer Price Index (CPI) release and next week’s Federal Reserve (Fed) monetary policy decision.
Crypto Today: Bitcoin, Ethereum, XRP stabilize at lower levels amid ETF outflows and macroeconomic risks
The broader cryptocurrency market is rising on Friday, with Bitcoin (BTC) trading above $77,000 after testing lower support near $76,500. Ethereum (ETH) shows signs of stability, hovering above the support provided at $2,400 despite capped upside at $2,500. Meanwhile, Ripple (XRP) holds above $1.33 after three straight days of declines, reflecting growing headwinds due to macroeconomic uncertainty.
Bitcoin pulls back as another golden cross fails to deliver
Earlier this week, Bitcoin formed a golden cross, a technical signal that occurs when the price’s 50-day moving average rises above the 200-day moving average and is conventionally viewed as a precursor to a bullish rally. Historically, however, that’s often not been the case.
Bitcoin: BTC retreats as macro headwinds grow
Bitcoin (BTC) remains under pressure, down over 4% this week and trading around $76,900 at the time of writing on Friday. Institutional demand shows signs of weakness as spot BTC Exchange Traded Funds (ETFs) are on track to end their three-week inflow streak, recording nearly $500 million in net outflows through Thursday.


