Solana resists FUD from panic sellers despite 20-hour outage over the weekend
- Solana hit a six-month high in social volume as the Ethereum-killer network battled a 20-hour long outage without a single successful transaction.
- SOL network’s outages have historically caused short-term spikes in exchange balances from market participants “panic selling.”
- Solana price resisted a decline in panic selling and yielded 2.3% losses over the weekend.

Solana (SOL) was a trending topic on social media platforms during the 20-hour network outage over the weekend. Despite Fear, Uncertainty and Doubt (FUD) among crypto market participants, SOL price resisted mass sell-off and yielded 2.3% losses for holders over the weekend.
Also read: Solana price nosedives as SOL network’s transaction processing craters with ‘Forking Event’
Solana’s 20-hour network outage and its impact on SOL price
Solana, an Ethereum-network competitor, handles all its consensus on-chain. This means communication between nodes that verify transactions (validators) is done on-chain as a transaction. This inflates transaction volume as well as Transactions Per Second (TPS).
In the graph seen below, the pink part represents actual transactions and the rest of it represents messages exchanged by validators.
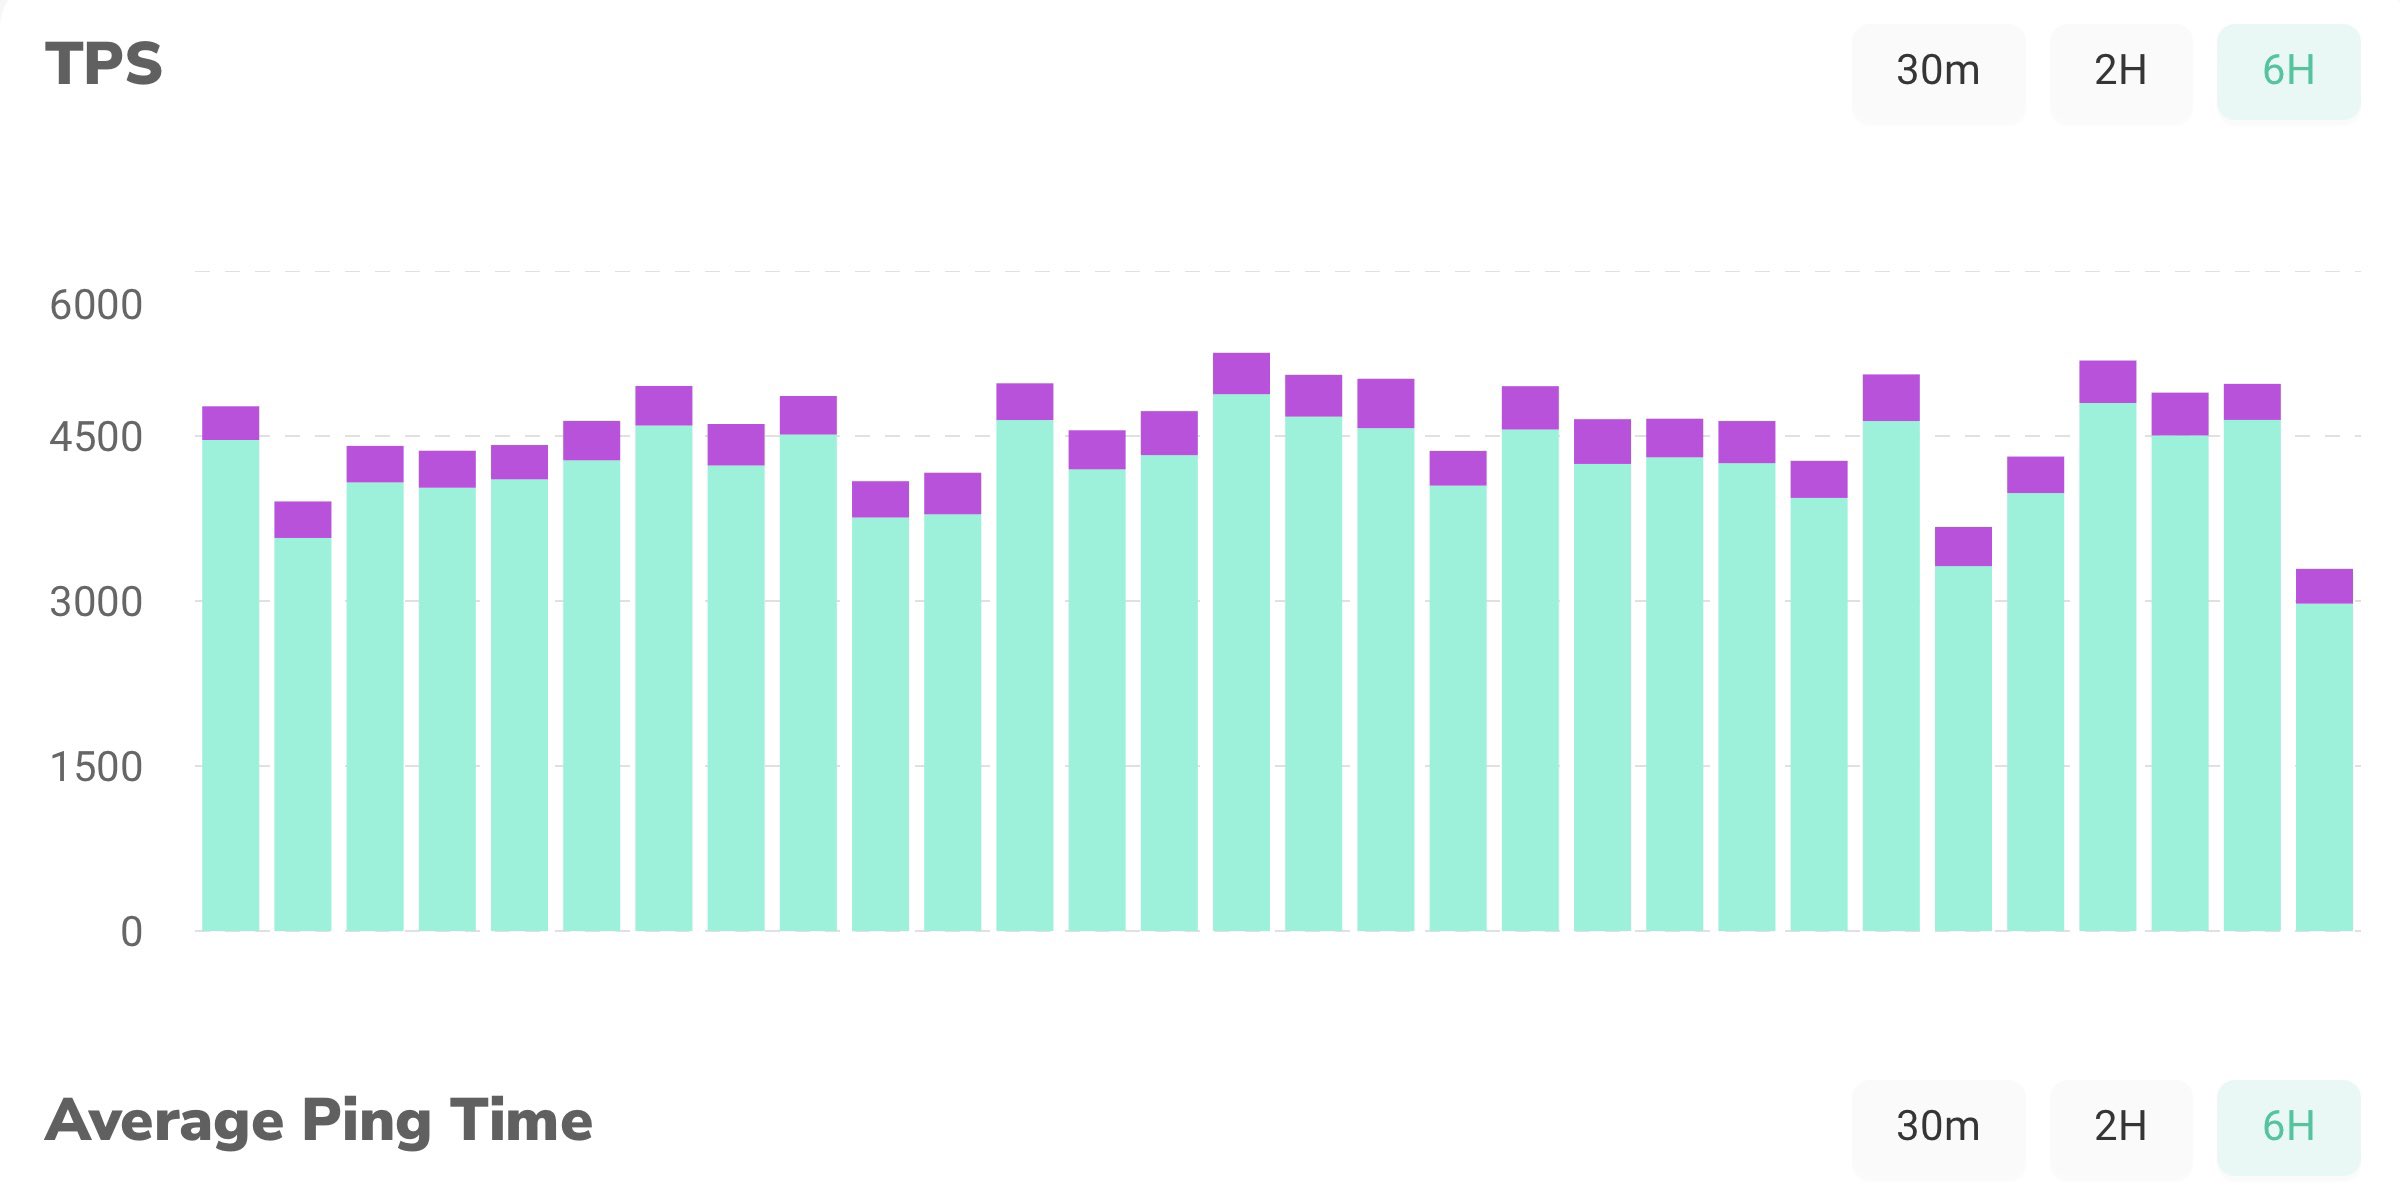
Solana Network TPS
Validators communicate with each other and “agree” on what is being proposed. If a user performs a swap, validators agree to make it happen, then update the user’s balance. All the communication between validators is represented by the teal part of the graph shown above.
When the network faces an outage, all validators go off-chain to discuss what to do next. This means the network relies on the availability of validators and their responsiveness to go back online. When the SOL blockchain gets overloaded or encounters a bug, it faces an outage.
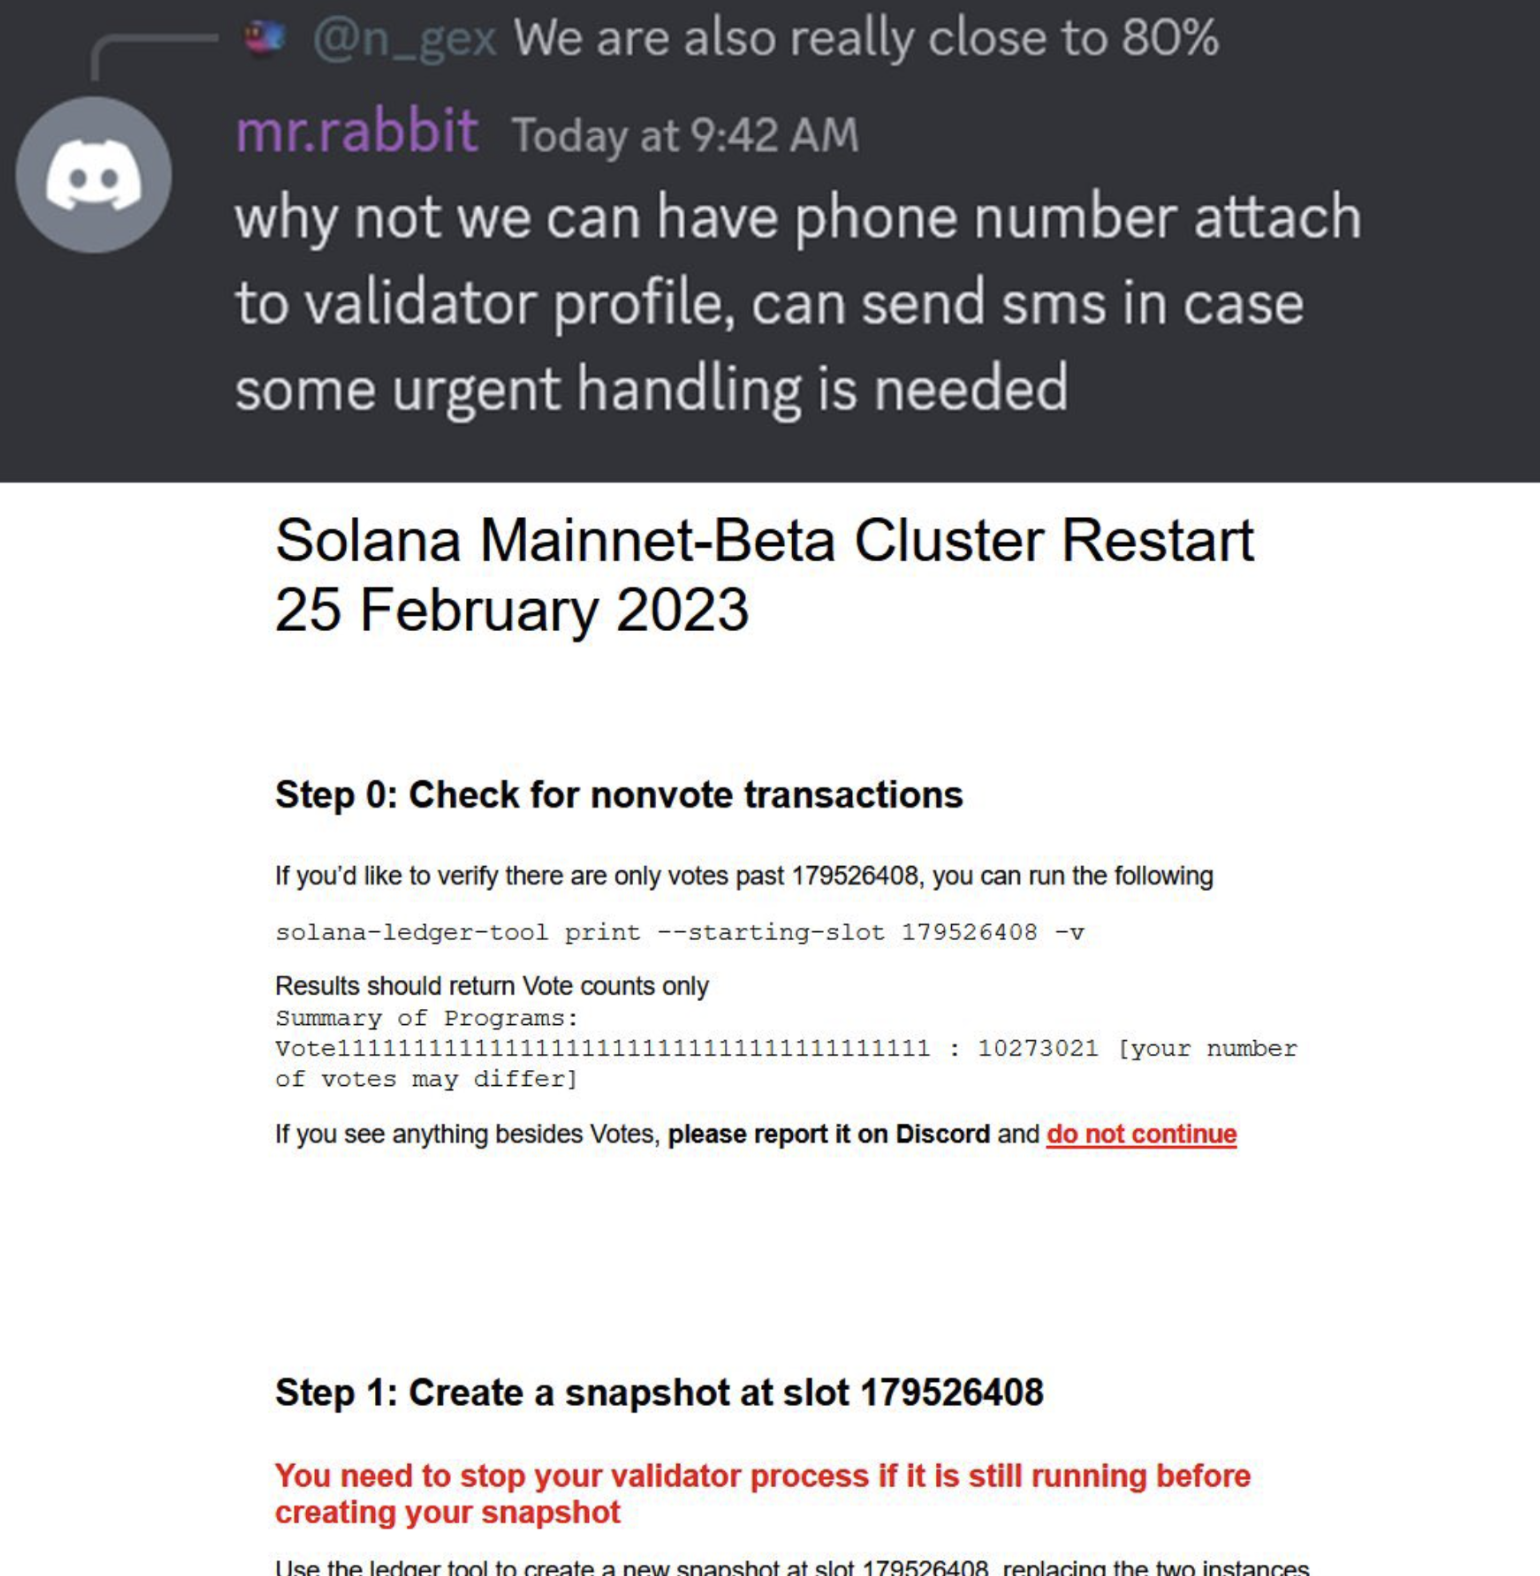
Solana network tackling an outage
Outages like these have historically caused short-term FUD and panic selling. Solana price resisted a mass sell-off over the weekend and yielded a 2.3% loss for holders.
While Ethereum-killer SOL emerged as a trending topic in crypto, across social-media platforms, the network went nearly 20 consecutive hours without a single successful transaction. SOL social media mentions hit a six-month peak of nearly 25,000 mentions.
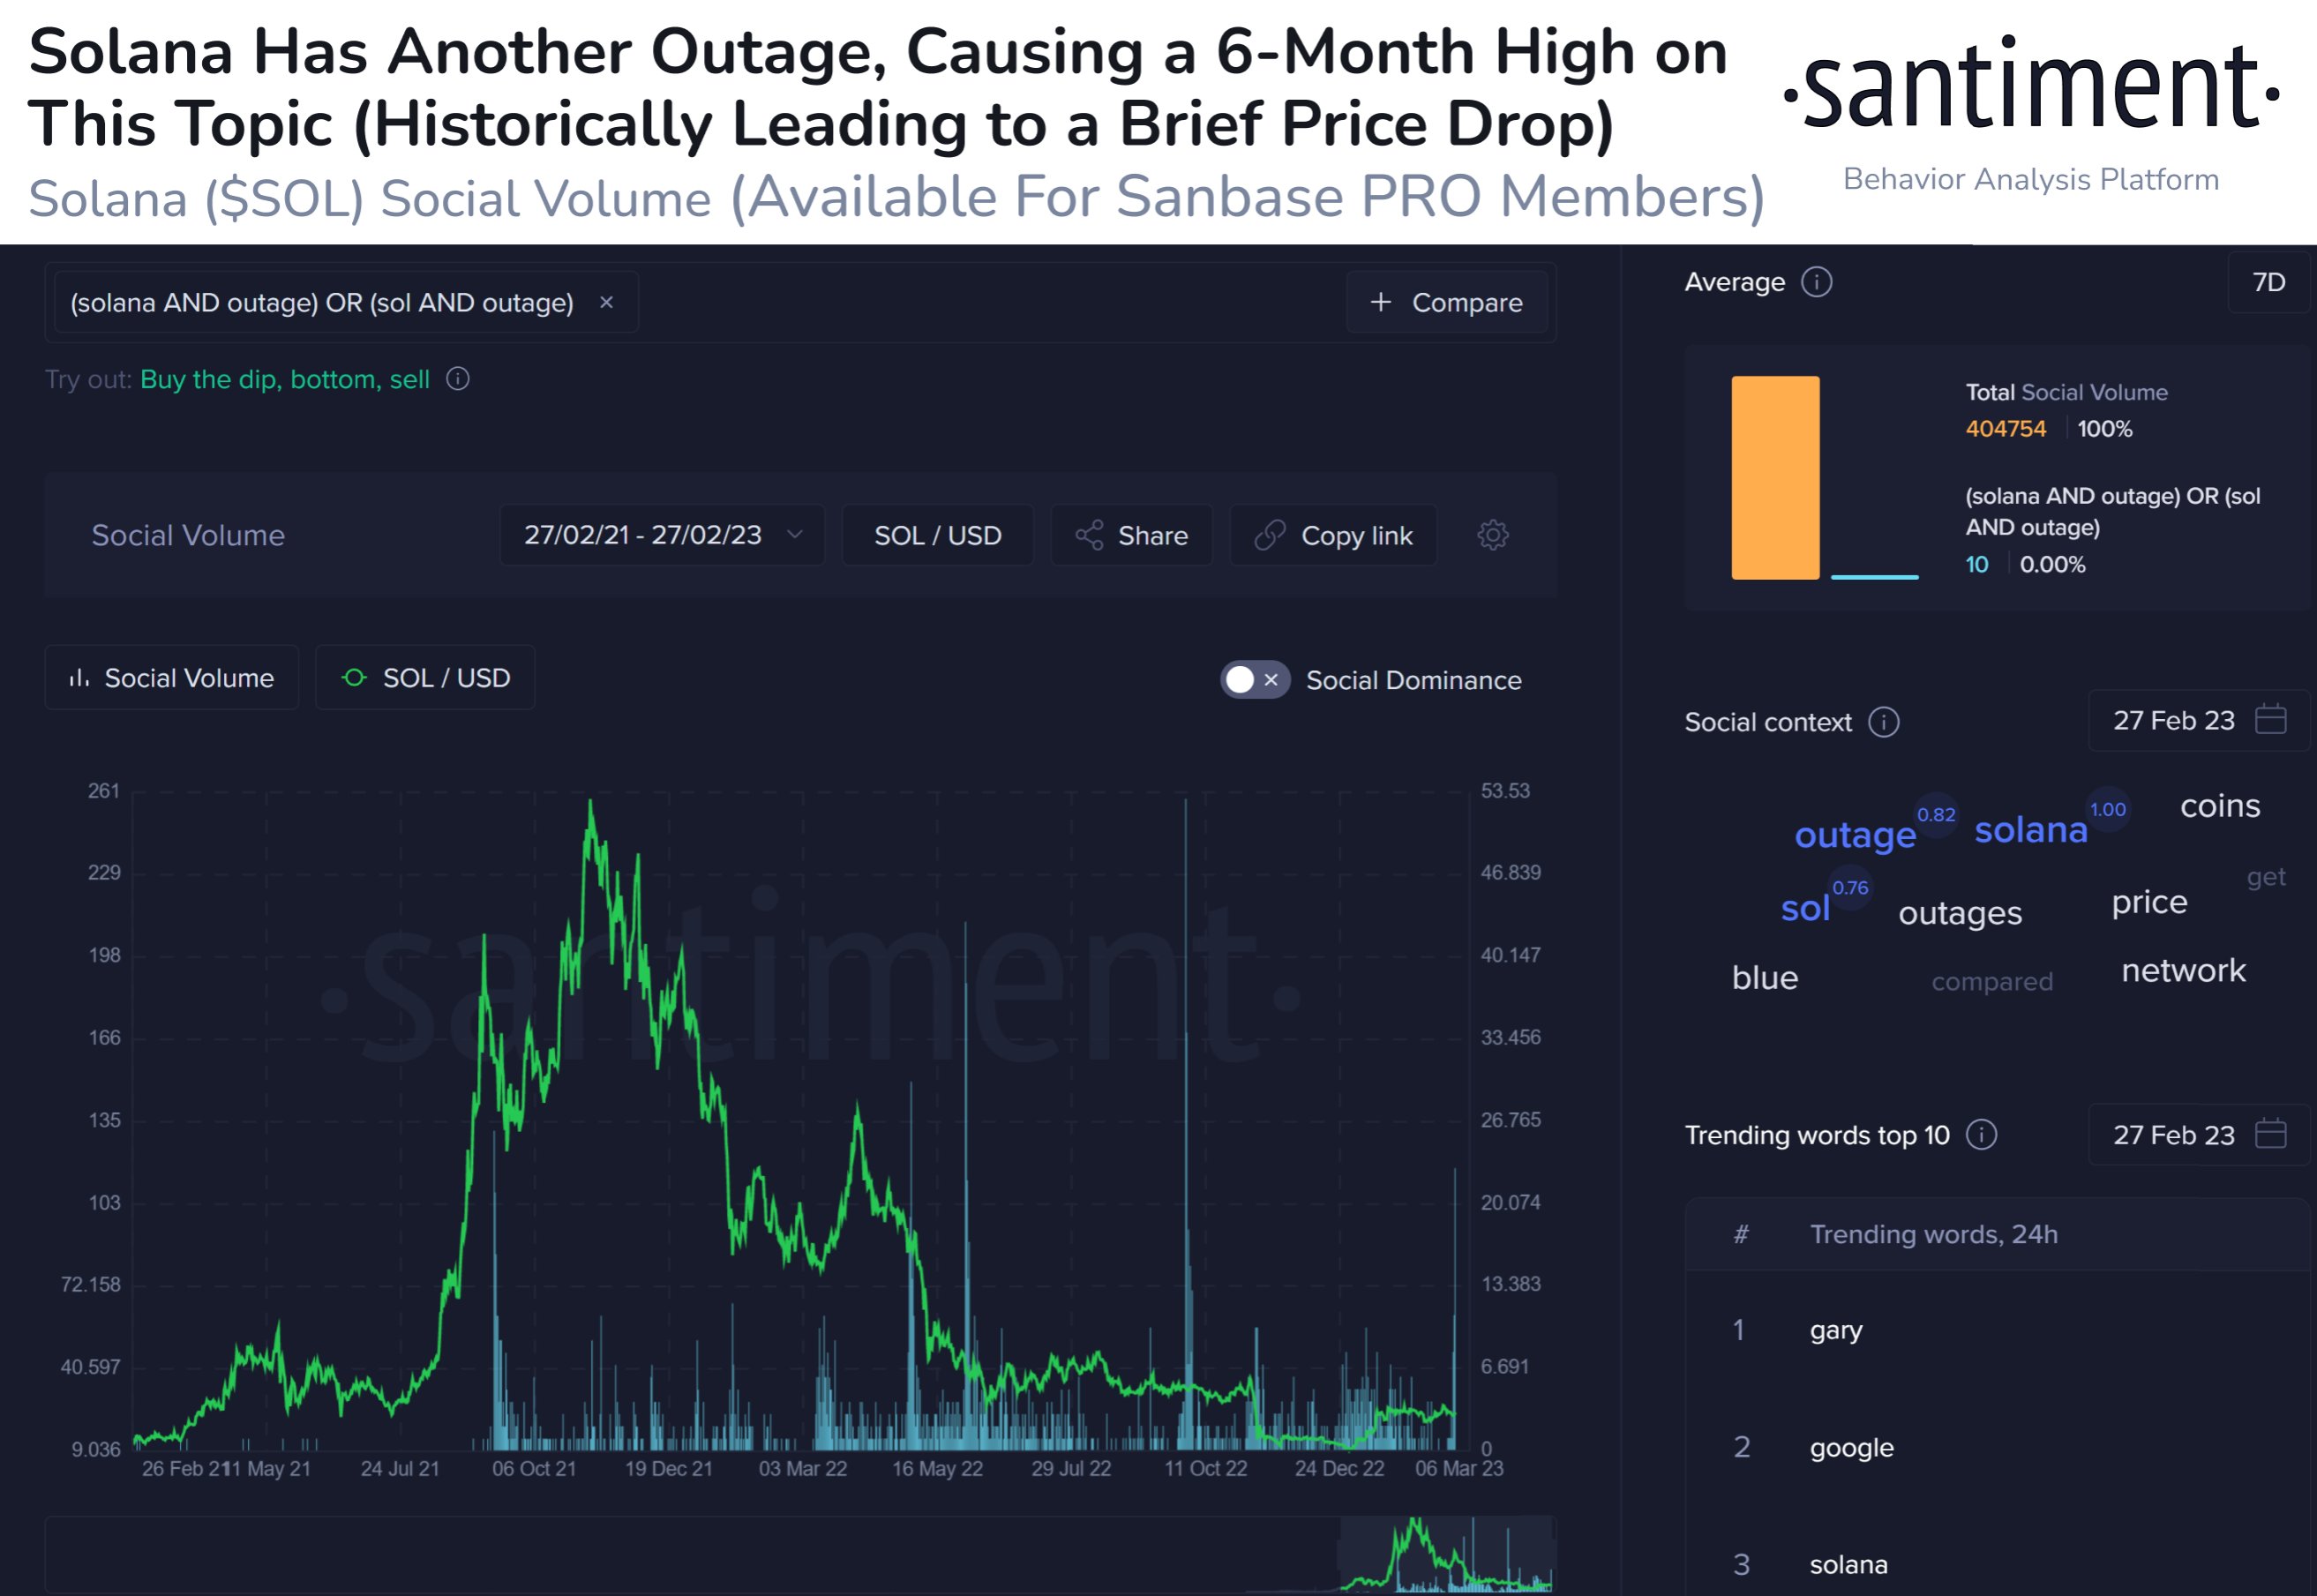
Solana social volume hits six-month peak
Despite a spike in social volume, SOL price remained steady. Solana is exchanging hands at $22.49 at press time.
A part of the reason SOL price may be holding up so well is that it could be reversing its long-term downtrend and starting a new uptrend, as is often the case when the impact of bad news on price is limited.
There are also technical reasons indicating a possible reversal of trend: on the weekly chart, for example, SOL price has broken above its down trendline three times since the bear trend began in November 2021, and market technicians see this as a sign the long-term trend may be reversing.
The Relative Strength Index (RSI), a momentum study, on the weekly chart, is also showing a bullish convergence with price, which happens when the RSI makes a new peak relative to its prior peak but price fails to. It indicates underlying strength in the move.
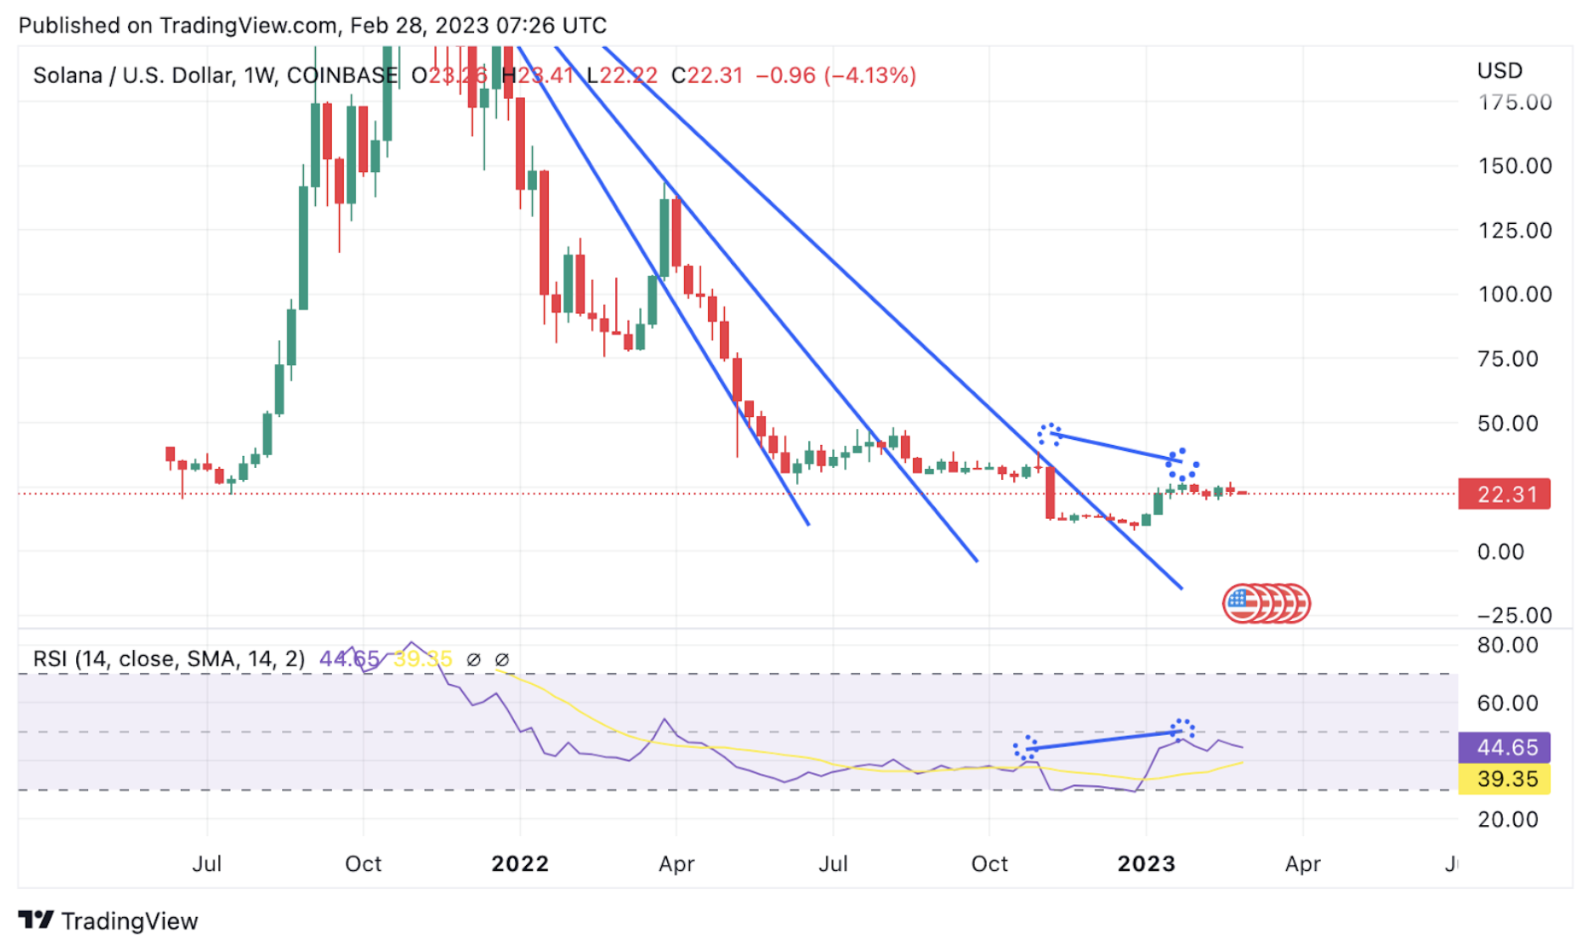
SOL/USDT price chart
On the daily chart, SOL price has broken above the key December 14 higher low at $15.05, signifying it has flipped the medium-term trend bullish. If it can hold above the $19.70 February 10 low, the outlook remains bullish, despite weak momentum as measured by RSI.
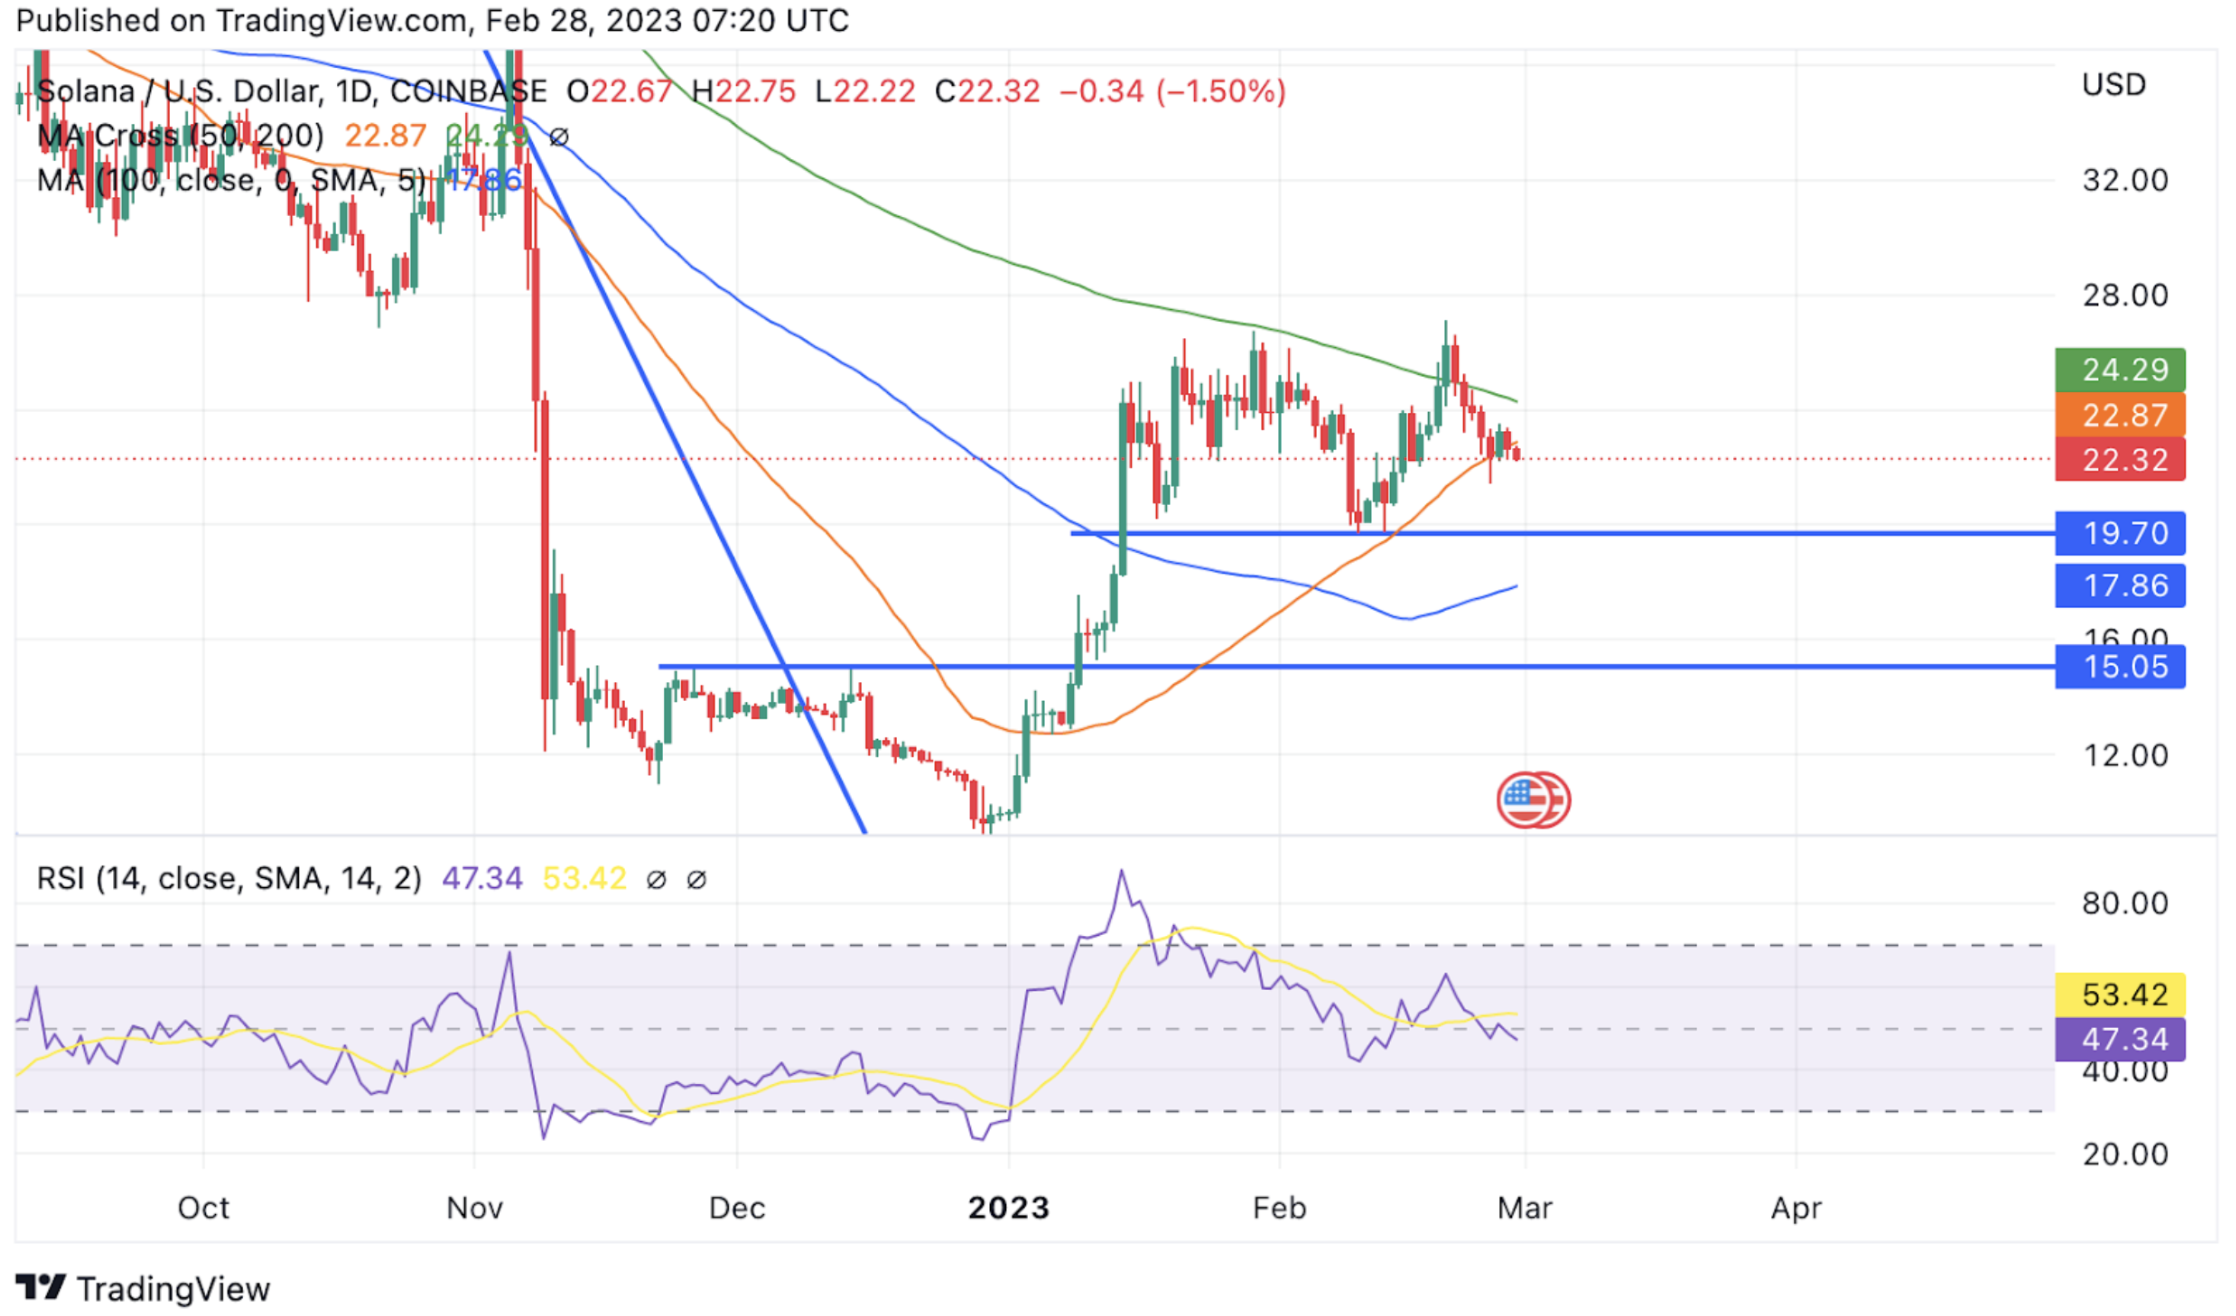
SOL/USD price chart
Bears are in the driving seat short term, however, given the FUD surrounding the outage, and for bulls to get excited again, it will probably require a break above the February 26 high at $23.54, suggesting the peaks and troughs are indeed rising again, with targets at $24.30, where the 200-day SMA sits and then $27.10.
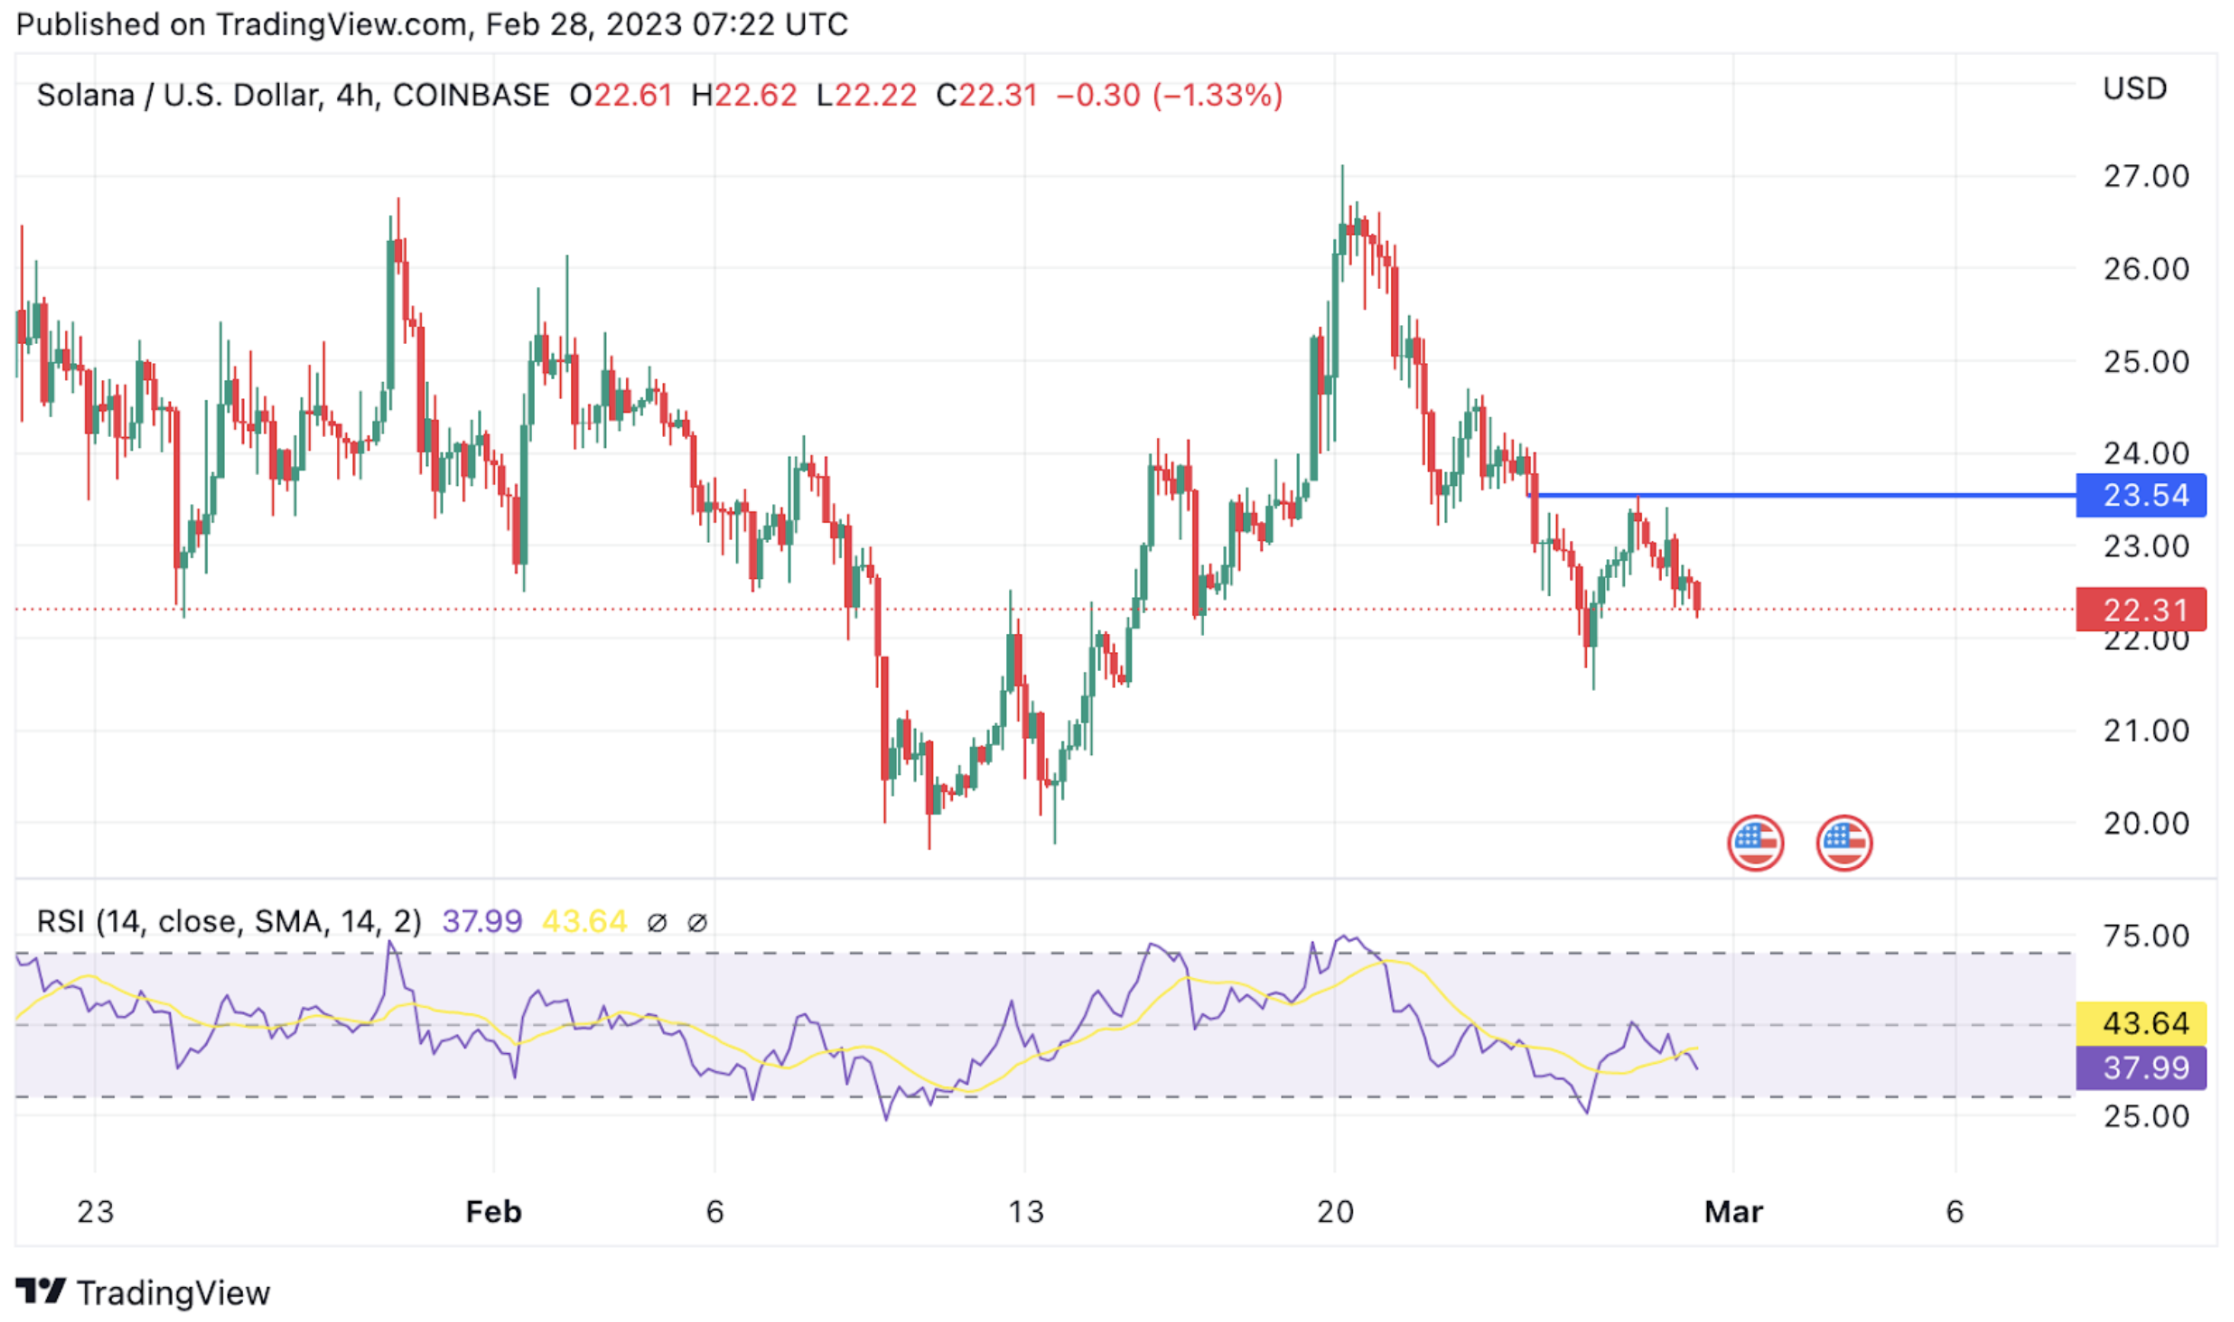
SOL/USD price chart
Author

Ekta Mourya
FXStreet
Ekta Mourya has extensive experience in fundamental and on-chain analysis, particularly focused on impact of macroeconomics and central bank policies on cryptocurrencies.


