Chainlink price prediction: Here's why LINK is gearing up for a 10% rally
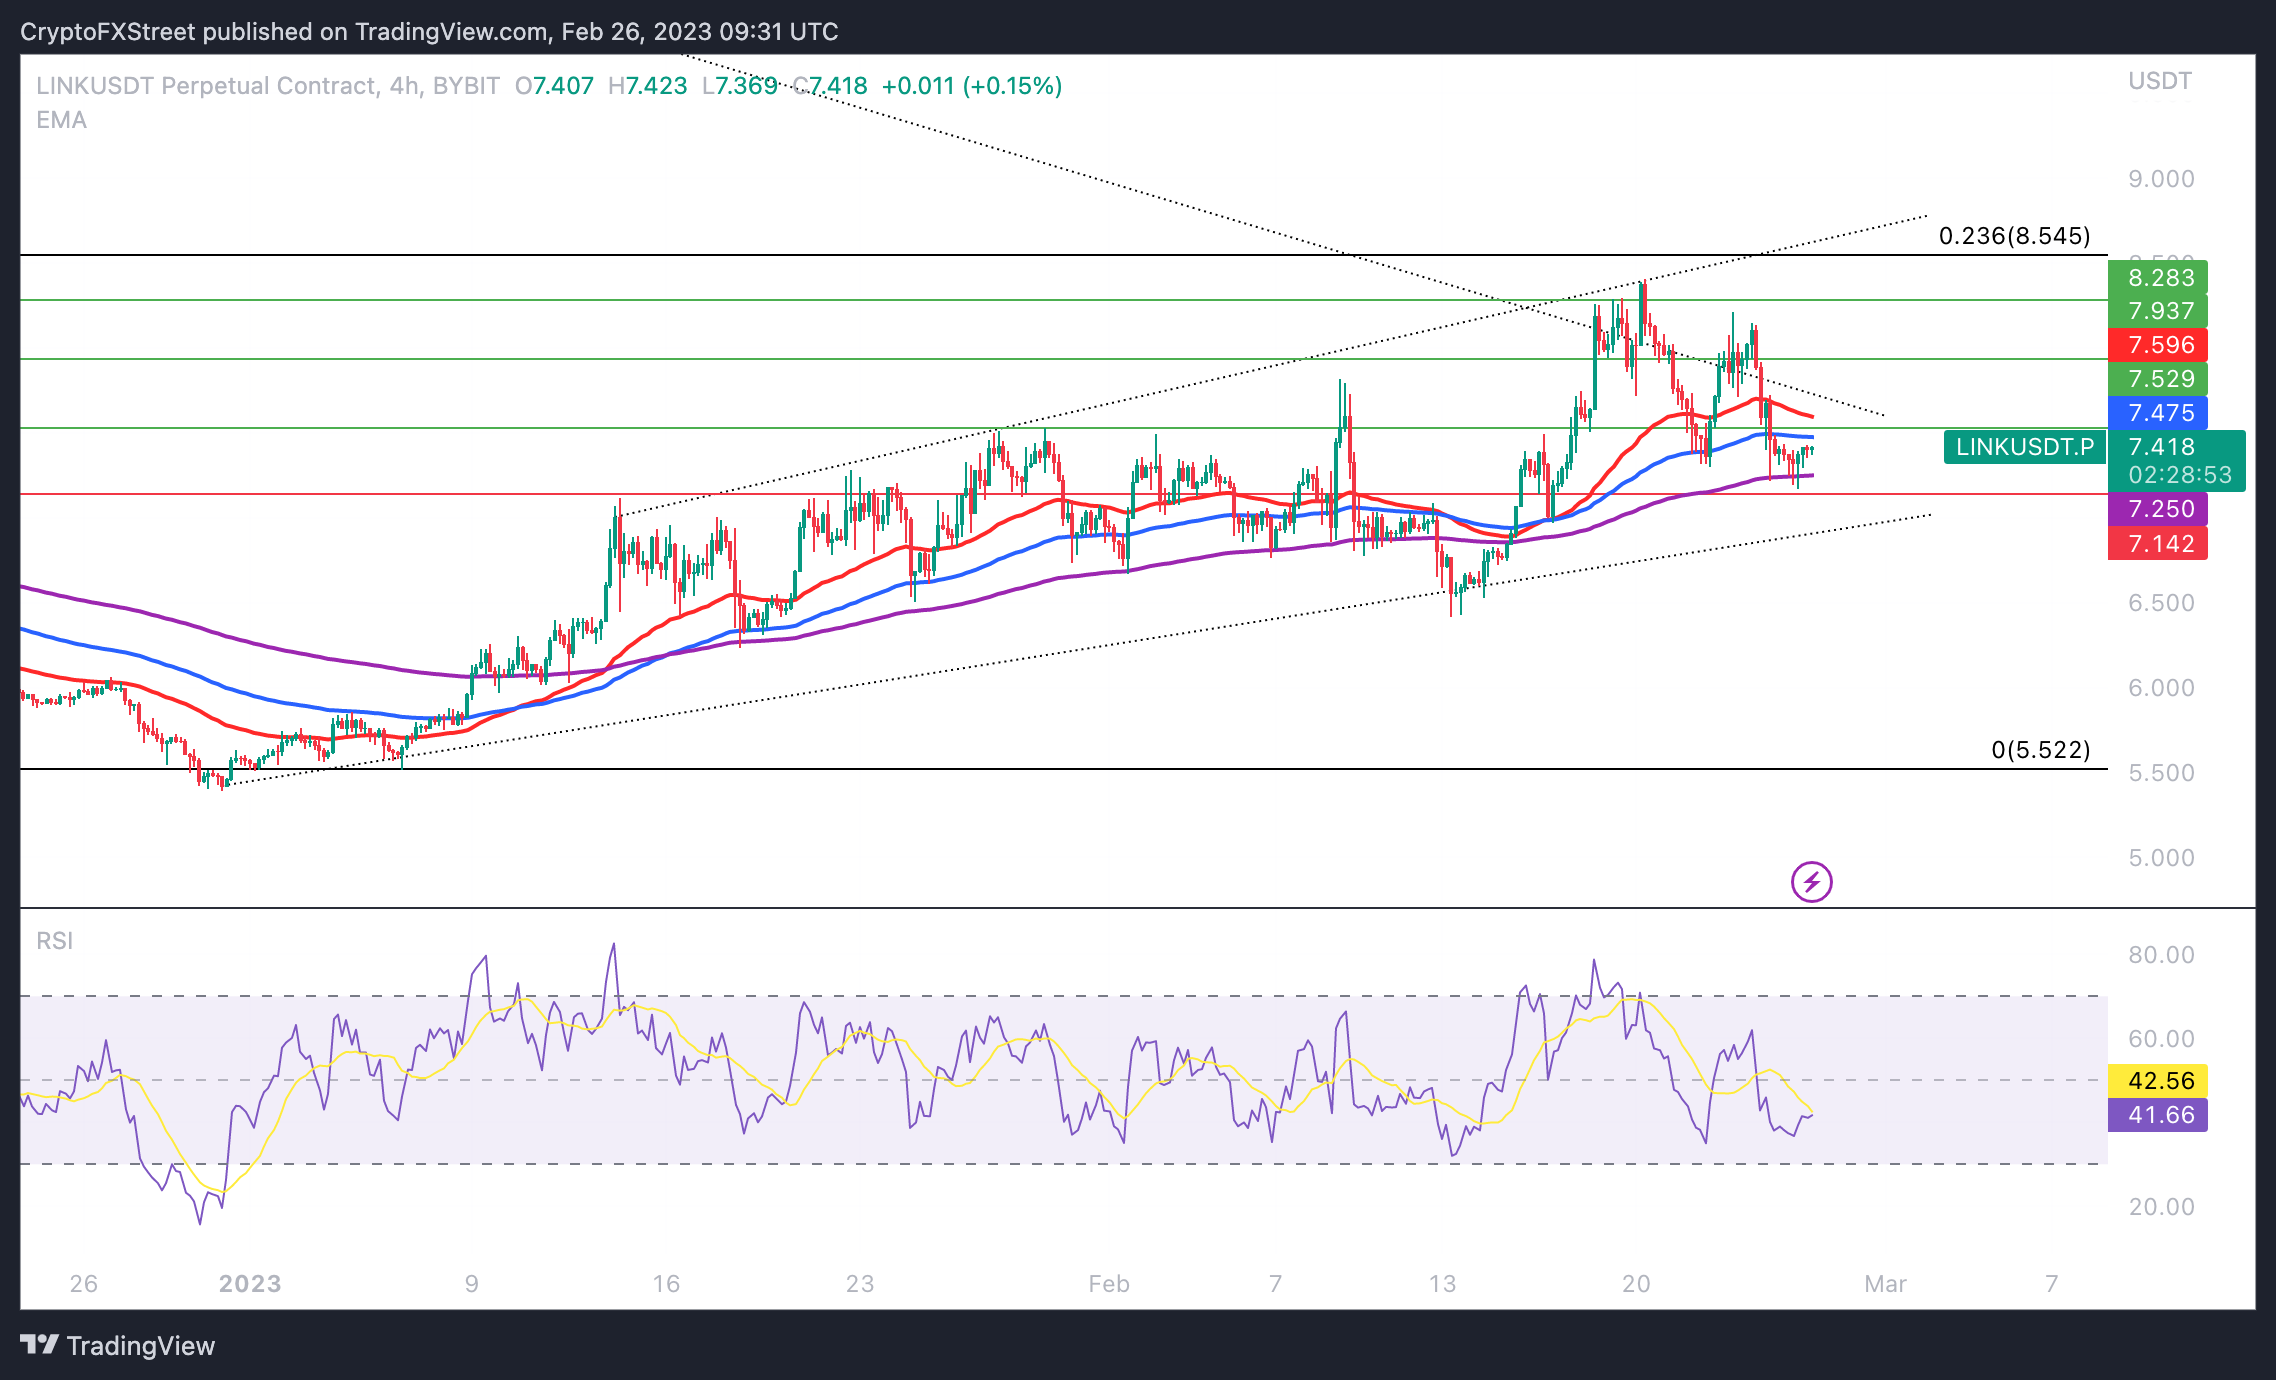
- Chainlink price shows signs of recovery from its recent decline after dropping from the $8.28 level.
- A climb above the three Exponential Moving Averages will validate LINK's bullish thesis, flipping the resistance at $7.41 into support.
- Invalidation of Chainlink's bullish thesis will occur if LINK price closes below the lower trendline at $6.90.
-637336005550289133.jpg)
Chainlink (LINK) price is in a short-term uptrend; the asset is close to a key resistance level at $7.41. Although LINK has flipped this hurdle into a support floor previously, investors are awaiting a climb above key resistance to confirm the continuation of the uptrend.
LINK has gathered steam on crypto Twitter since the DeFi scaling announcement, where Chainlink proposes the tokenization of real-world assets on a global scale.
Also read: Here’s why Bitcoin miners are bullish and what it means for BTC
Chainlink prepares for continuation of its uptrend
Chainlink price rallied nearly 50% between December 31 and February 20, 2023. LINK is battling resistance at $7.41 since th consolidation started on February 24. During its consolidation phase, Chainlink price nosedived closer to support at $7.14.
The setup in the Chainlink 4H price chart forecasts a 10% upswing to the bullish target of $8.28. A 10% rally in LINK could push the asset to its target of $8.28.
LINK/USDT Perpetual Contract chart
The chart above shows three key resistance levels in the LINK price chart at $7.41, $7.52 and $7.93. Chainlink price target is the $8.28 level. The Relative Strength Index (RSI), a momentum indicator, climbed to 41.66. As RSI stays above the oversold region and continues its climb towards the neutral level at 50, it signals the underlying strength of Chainlink’s recovery.
Author

Ekta Mourya
FXStreet
Ekta Mourya has extensive experience in fundamental and on-chain analysis, particularly focused on impact of macroeconomics and central bank policies on cryptocurrencies.


