- Solana price is revisiting the $115.51 to $144.70 demand zone, hoping for an uptrend.
- A bullish reaction from this barrier will likely result in a 20% ascent to the weekly resistance barrier at $174.37.
- A four-hour candlestick close below the $115.50 barrier will invalidate the bullish thesis for SOL.
Solana price has been consolidating close to a daily demand zone, suggesting a lack of buying pressure despite the obvious. The lack of volatility suggests accumulation or a genuine lack of buyers. If it is the former, investors can expect SOL to break out from this consolidation and kick-start a massive run-up.
Solana price contemplates a move higher
Solana price has traded close to the daily demand zone, extending from $115.51 to $144.70 for more than three days. This price action has created a consolidation that suggests that buyers are either accumulating or lack the momentum to kick-start an uptrend,
As mentioned above, if it is the former, there is a good chance Solana price will break out from this sideways movement and trigger an uptrend.
The resulting bull rally will eye a retest of the daily supply zone, stretching from $169.79 to $179.19. However, market participants can expect SOL to pierce this resistance area and tag the weekly resistance barrier at $174.37.
In total, this run-up would constitute a 20% ascent from the current position - $145.20. Proof for further uptrend is not available, so one can assume that $174.37 is likely where Solana price will form its local top.
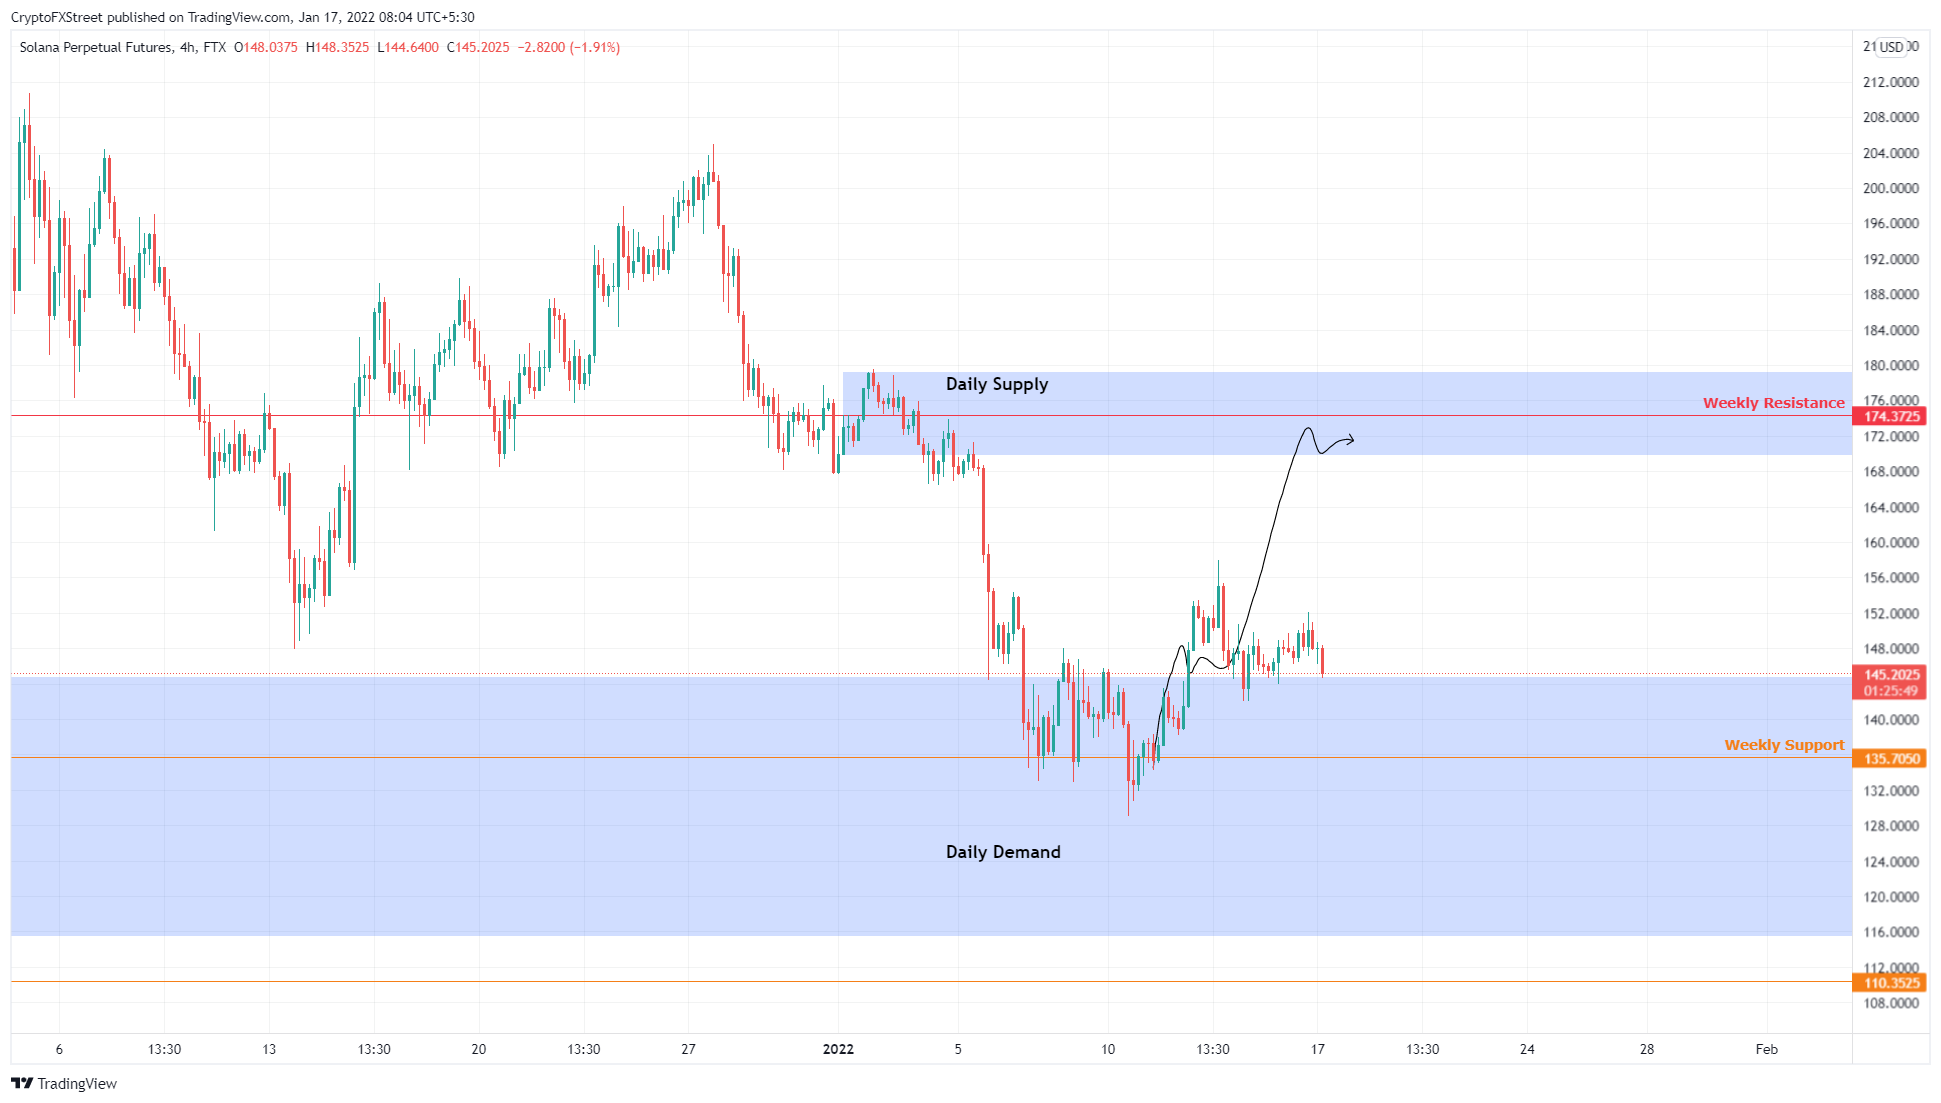
SOL/USDT 4-hour chart
On the other hand, if the consolidation fails to break out, it would indicate a lack of buying pressure from the participants. This failure to act from the bulls’ part would signal weakness, allowing sellers to take control, triggering a downtrend to the weekly support level at $135.70.
If the bulls fail to respond here and SOL produces a four-hour candlestick close below the $115.50 barrier, it will create a lower low, invalidating the bullish thesis. In this case, Solana price will likely retest the $110.30 support floor. Here the bulls could give the uptrend another go.
Information on these pages contains forward-looking statements that involve risks and uncertainties. Markets and instruments profiled on this page are for informational purposes only and should not in any way come across as a recommendation to buy or sell in these assets. You should do your own thorough research before making any investment decisions. FXStreet does not in any way guarantee that this information is free from mistakes, errors, or material misstatements. It also does not guarantee that this information is of a timely nature. Investing in Open Markets involves a great deal of risk, including the loss of all or a portion of your investment, as well as emotional distress. All risks, losses and costs associated with investing, including total loss of principal, are your responsibility. The views and opinions expressed in this article are those of the authors and do not necessarily reflect the official policy or position of FXStreet nor its advertisers. The author will not be held responsible for information that is found at the end of links posted on this page.
If not otherwise explicitly mentioned in the body of the article, at the time of writing, the author has no position in any stock mentioned in this article and no business relationship with any company mentioned. The author has not received compensation for writing this article, other than from FXStreet.
FXStreet and the author do not provide personalized recommendations. The author makes no representations as to the accuracy, completeness, or suitability of this information. FXStreet and the author will not be liable for any errors, omissions or any losses, injuries or damages arising from this information and its display or use. Errors and omissions excepted.
The author and FXStreet are not registered investment advisors and nothing in this article is intended to be investment advice.
Recommended Content
Editors’ Picks
Ripple's move above this key level could trigger nearly 50% rally for XRP
Ripple has overcome a critical resistance level and flipped into a support floor on the weekly time frame. This development happened while XRP tightly consolidated for roughly 250 days. Investors can expect XRP to kickstart a massive rally.
Optimism price outlook with nearly $90 million worth of OP tokens flooding markets on Friday
Optimism volatility has shrunk in the ours leading to the network’s cliff unlock. It joins the likes of dYdX and Sui, which have similar events on their calendars. As token unlocks are often considered bearish catalysts, investors should brace for a reaction after the event.
Top 3 Price Prediction Bitcoin, Ethereum, Ripple: Retail watches from the sidelines with a bias for shorts
Bitcoin could clear $73,777 peak as BTC bulls resurface. Ethereum might fall 10% before next leg up as ETH RSI teases with sell signal. XRP could lose $0.6000 threshold as Ripple bulls fail to show up.
Jito price could hit $6 as JTO coils up inside this bullish pattern
Jito price action shows a potential cup and handle formation. Based on theoretical measurement rules, a successful breakout could yield a 56% rally to $6.0. A breakdown of the $3.86 support level would create a lower low for JTO and invalidate the bullish thesis.
Bitcoin: BTC may have recovered, but is it out of the woods?
Bitcoin’s (BTC) upward momentum has shown a significant decline for the past two weeks or so. This development led to a bearish signal on the weekly and an uncertain outlook on the monthly.