Solana struggles to maintain gains as SOL attempts to hold $150 as support
- Solana price action pulls back from its recent recovery.
- Bulls and bears await market direction that will dictate the future trend.
- Bulls remain in marginal control, but bears can quickly take over.

Solana price rallied strongly off the bottom of its bull flag, pushing higher to the midpoint before facing selling pressure. As a result, bulls see a pause before a breakout while bears see a lower high and continuation move down.
Solana price at an inflection point, market direction to be determined soon
Solana price is currently up against one of the biggest battles between the bulls and bears of the last four months. Except for a quick spike above the Tenkan-Sen earlier in the Thursday trading session, the majority of the trading day has been spent right on the Tenkan-Sen at $150.
From a bearish perspective, bears may interpret the daily candlestick as a shooting star candlestick pattern. The shooting star is an inherently bearish single candlestick pattern that indicates sellers are in control when it appears at the top of a swing. Continued selling pressure for Solana price will likely occur if Solana closes below the Tenkan-Sen and mid-point of the bull flag.
On the other hand, bulls will look at several conditions before re-entering or opening new longs. First, bulls will want to see if the daily volume is higher or lower than average – especially if a shooting star candlestick pattern forms. If that pattern forms and the volume is less than Wednesday's volume or less than the twenty-day volume average, they may feel emboldened and confident that the pullback today was temporary.
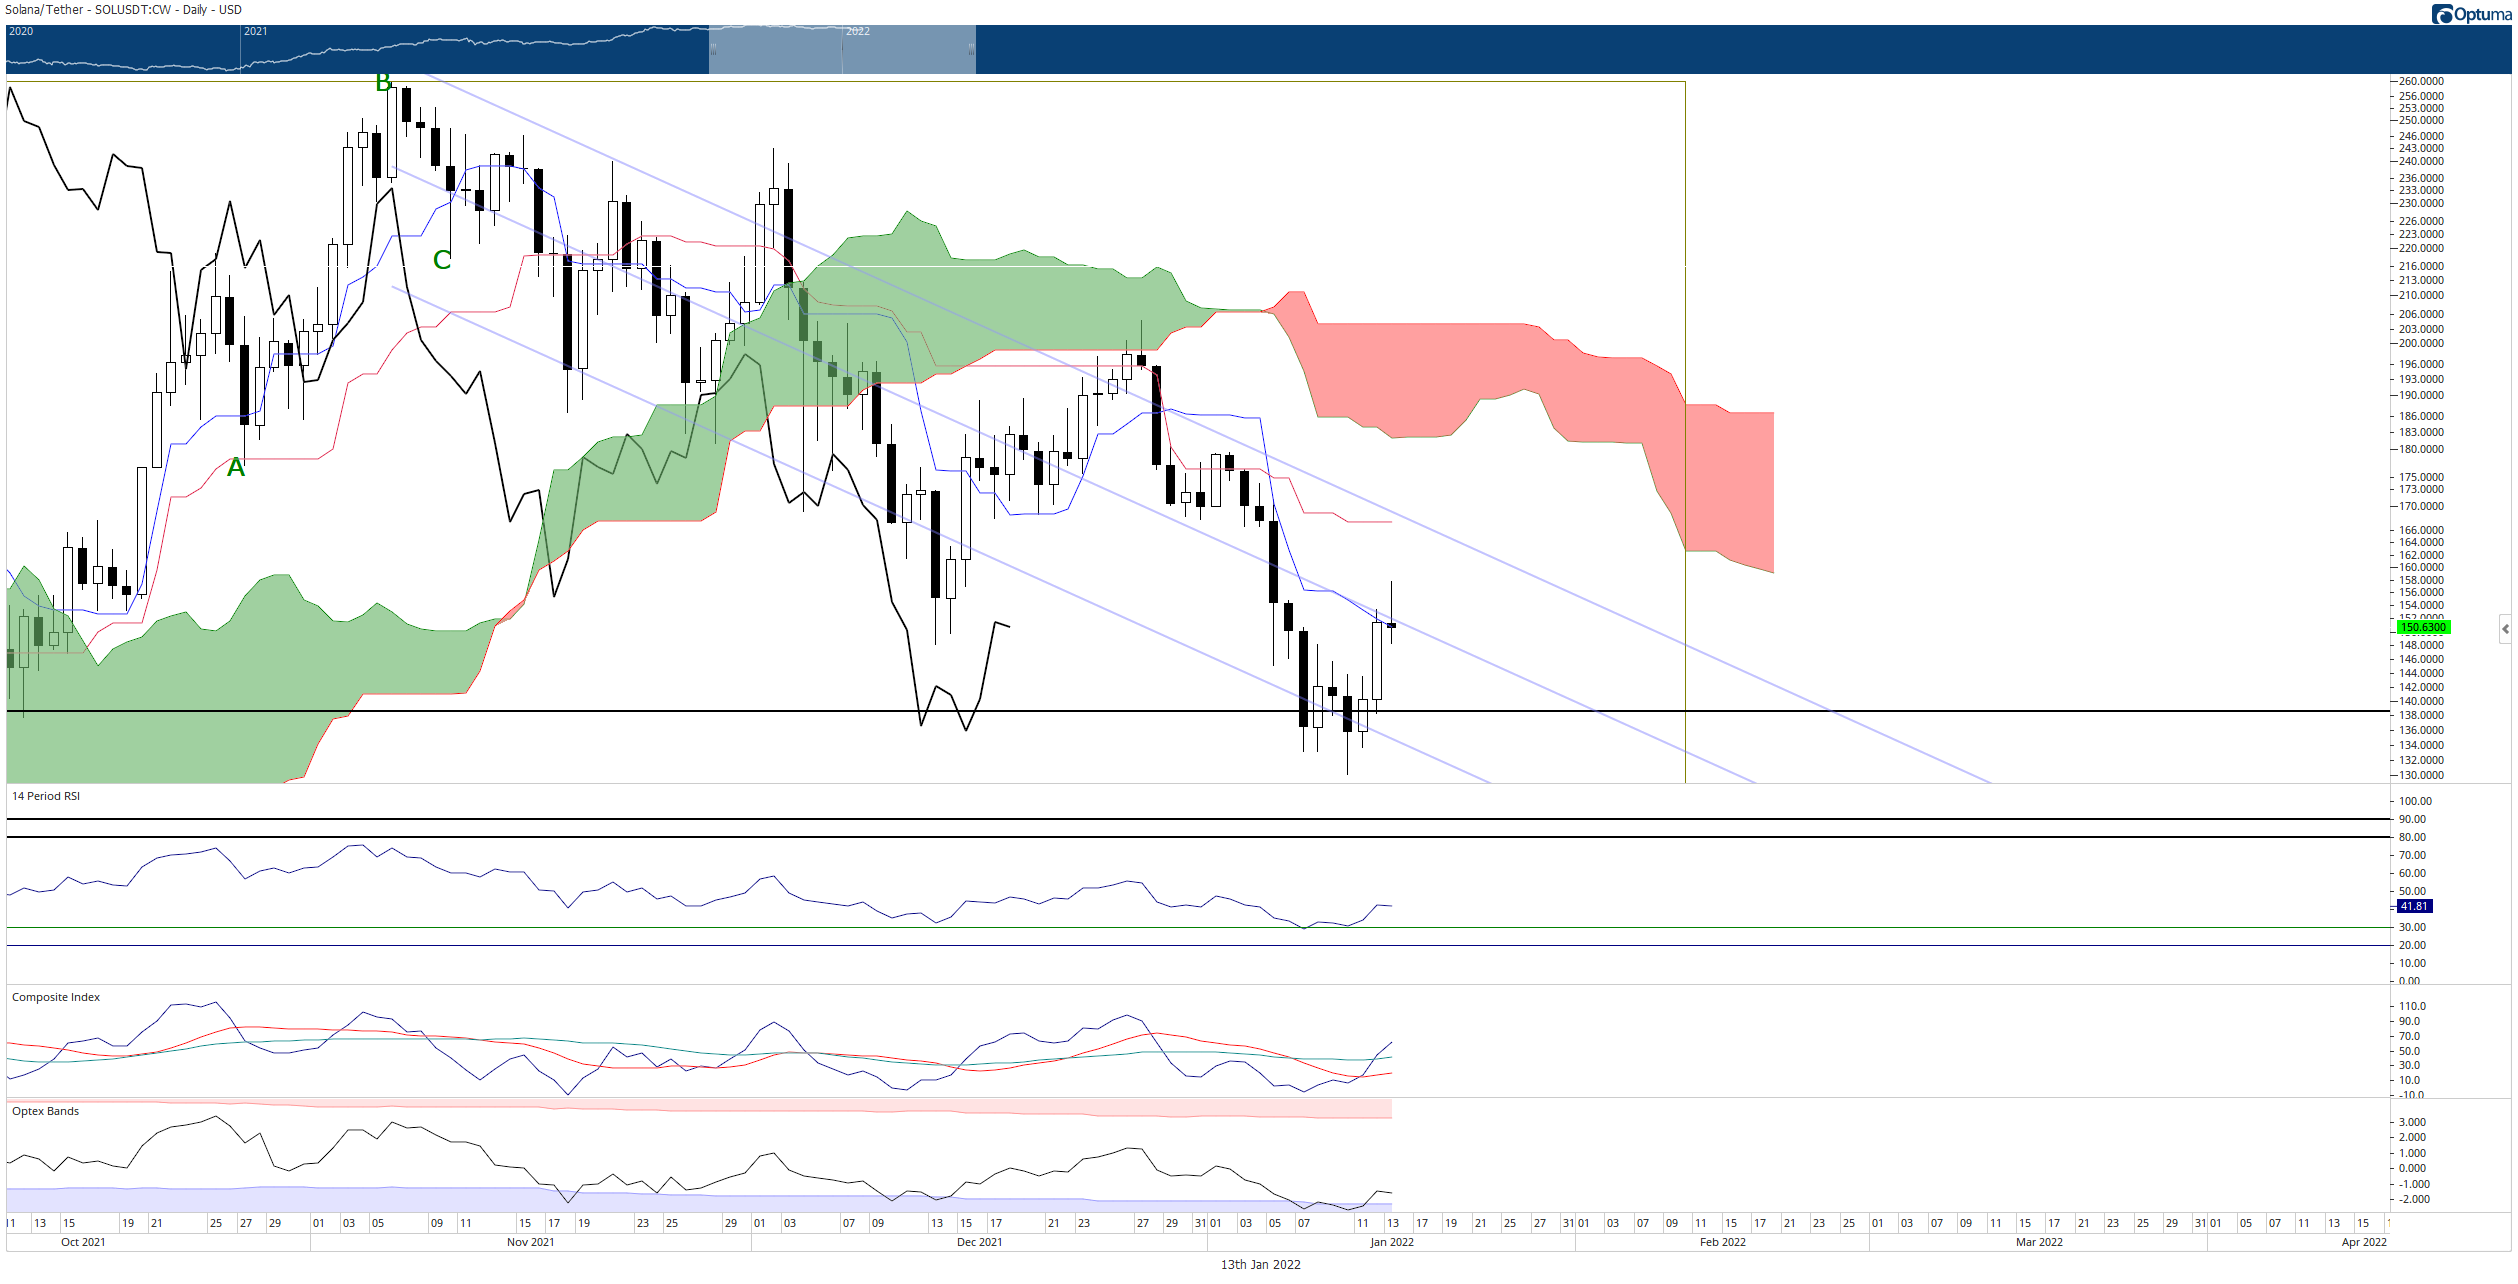
SOL/USDT Daily Ichimoku Chart
Bulls will also look for a close above the mid-line and the Tenkan-Sen as confirmation that higher prices are incoming.
Upside potential may be limited to the confluence of resistance at the top of the bull flag and the Kijun-Sen at $186. Above that, resistance will likely not develop until the $200 level.
Author

Jonathan Morgan
Independent Analyst
Jonathan has been working as an Independent future, forex, and cryptocurrency trader and analyst for 8 years. He also has been writing for the past 5 years.



