Solana Price Prediction: SOL likely to fall another 20% before buyers step in
- Solana price has faced intense selling pressure around the $200 psychological level.
- Technicals hint at another 10% to 20% correction on the cards for SOL.
- Sidelined buyers could get a buying opportunity on the potential retest of $134.

Solana (SOL) price has undone half of the gains noted in the past week as it trades below the $200 psychological level. This bearish outlook could lead to further corrections over the weekend or the next week.
Also read: Solana failed transactions exceed 70% as meme coin frenzy attracts bots
Solana price needs a breather
Solana price has shot up 1022% since September 2023. The two main reasons for this mind-melting rally are Bitcoin’s bull run and the overselling of SOL due to its connection with the now-bankrupt crypto exchange FTX. Last week, Solana soared 39%, registering the highest weekly gain of 2024.
But in the past five days, Solana price faced massive rejection around the $200 psychological level and is currently trading nearly 16% lower than the previous week’s closing level. This correction is potentially aided by:
- Bitcoin’s bearish outlook: BTC is crashing ahead due to the weekly sell signal. As profit-taking ensues, the pioneer cryptocurrency will likely take altcoins down with it.
- Bearish divergence: The weekly SOL chart has spawned a higher high while the Relative Strength Index (RSI) has formed a lower high, indicating a non-conformity termed bearish divergence. This setup often signals a slowdown in momentum which leads to a potential reversal or a short-term pullback.
- MRI's potential sell signal: The Momentum Reversal Index (MRI) has flashed a yellow down arrow, which spawns on the eighth consecutive up candlestick. This development warns that the next up candlestick for SOL would flash a sell signal that forecasts a one-to-four down candlesticks.
Considering the bullish market conditions, a reversal is unlikely, which suggests that SOL is in for a correction. Additionally, the bear market that began in early November 2021 saw a dead cat bounce to $200, which is where SOL is currently facing another sell-off. Therefore, the stable support levels where buyers might find Solana price attractive include the weekly foothold at $152 followed by $134, which is the midpoint of the previous bear market crash.
Ideally a sweep of the $134 would be the best place for accumulation, but due to the extremely bullish outlook investors should note that this move would be have low probability of occurring.
Read more: Meet the woman behind Solana hit meme coin ‘Doland Tremp’
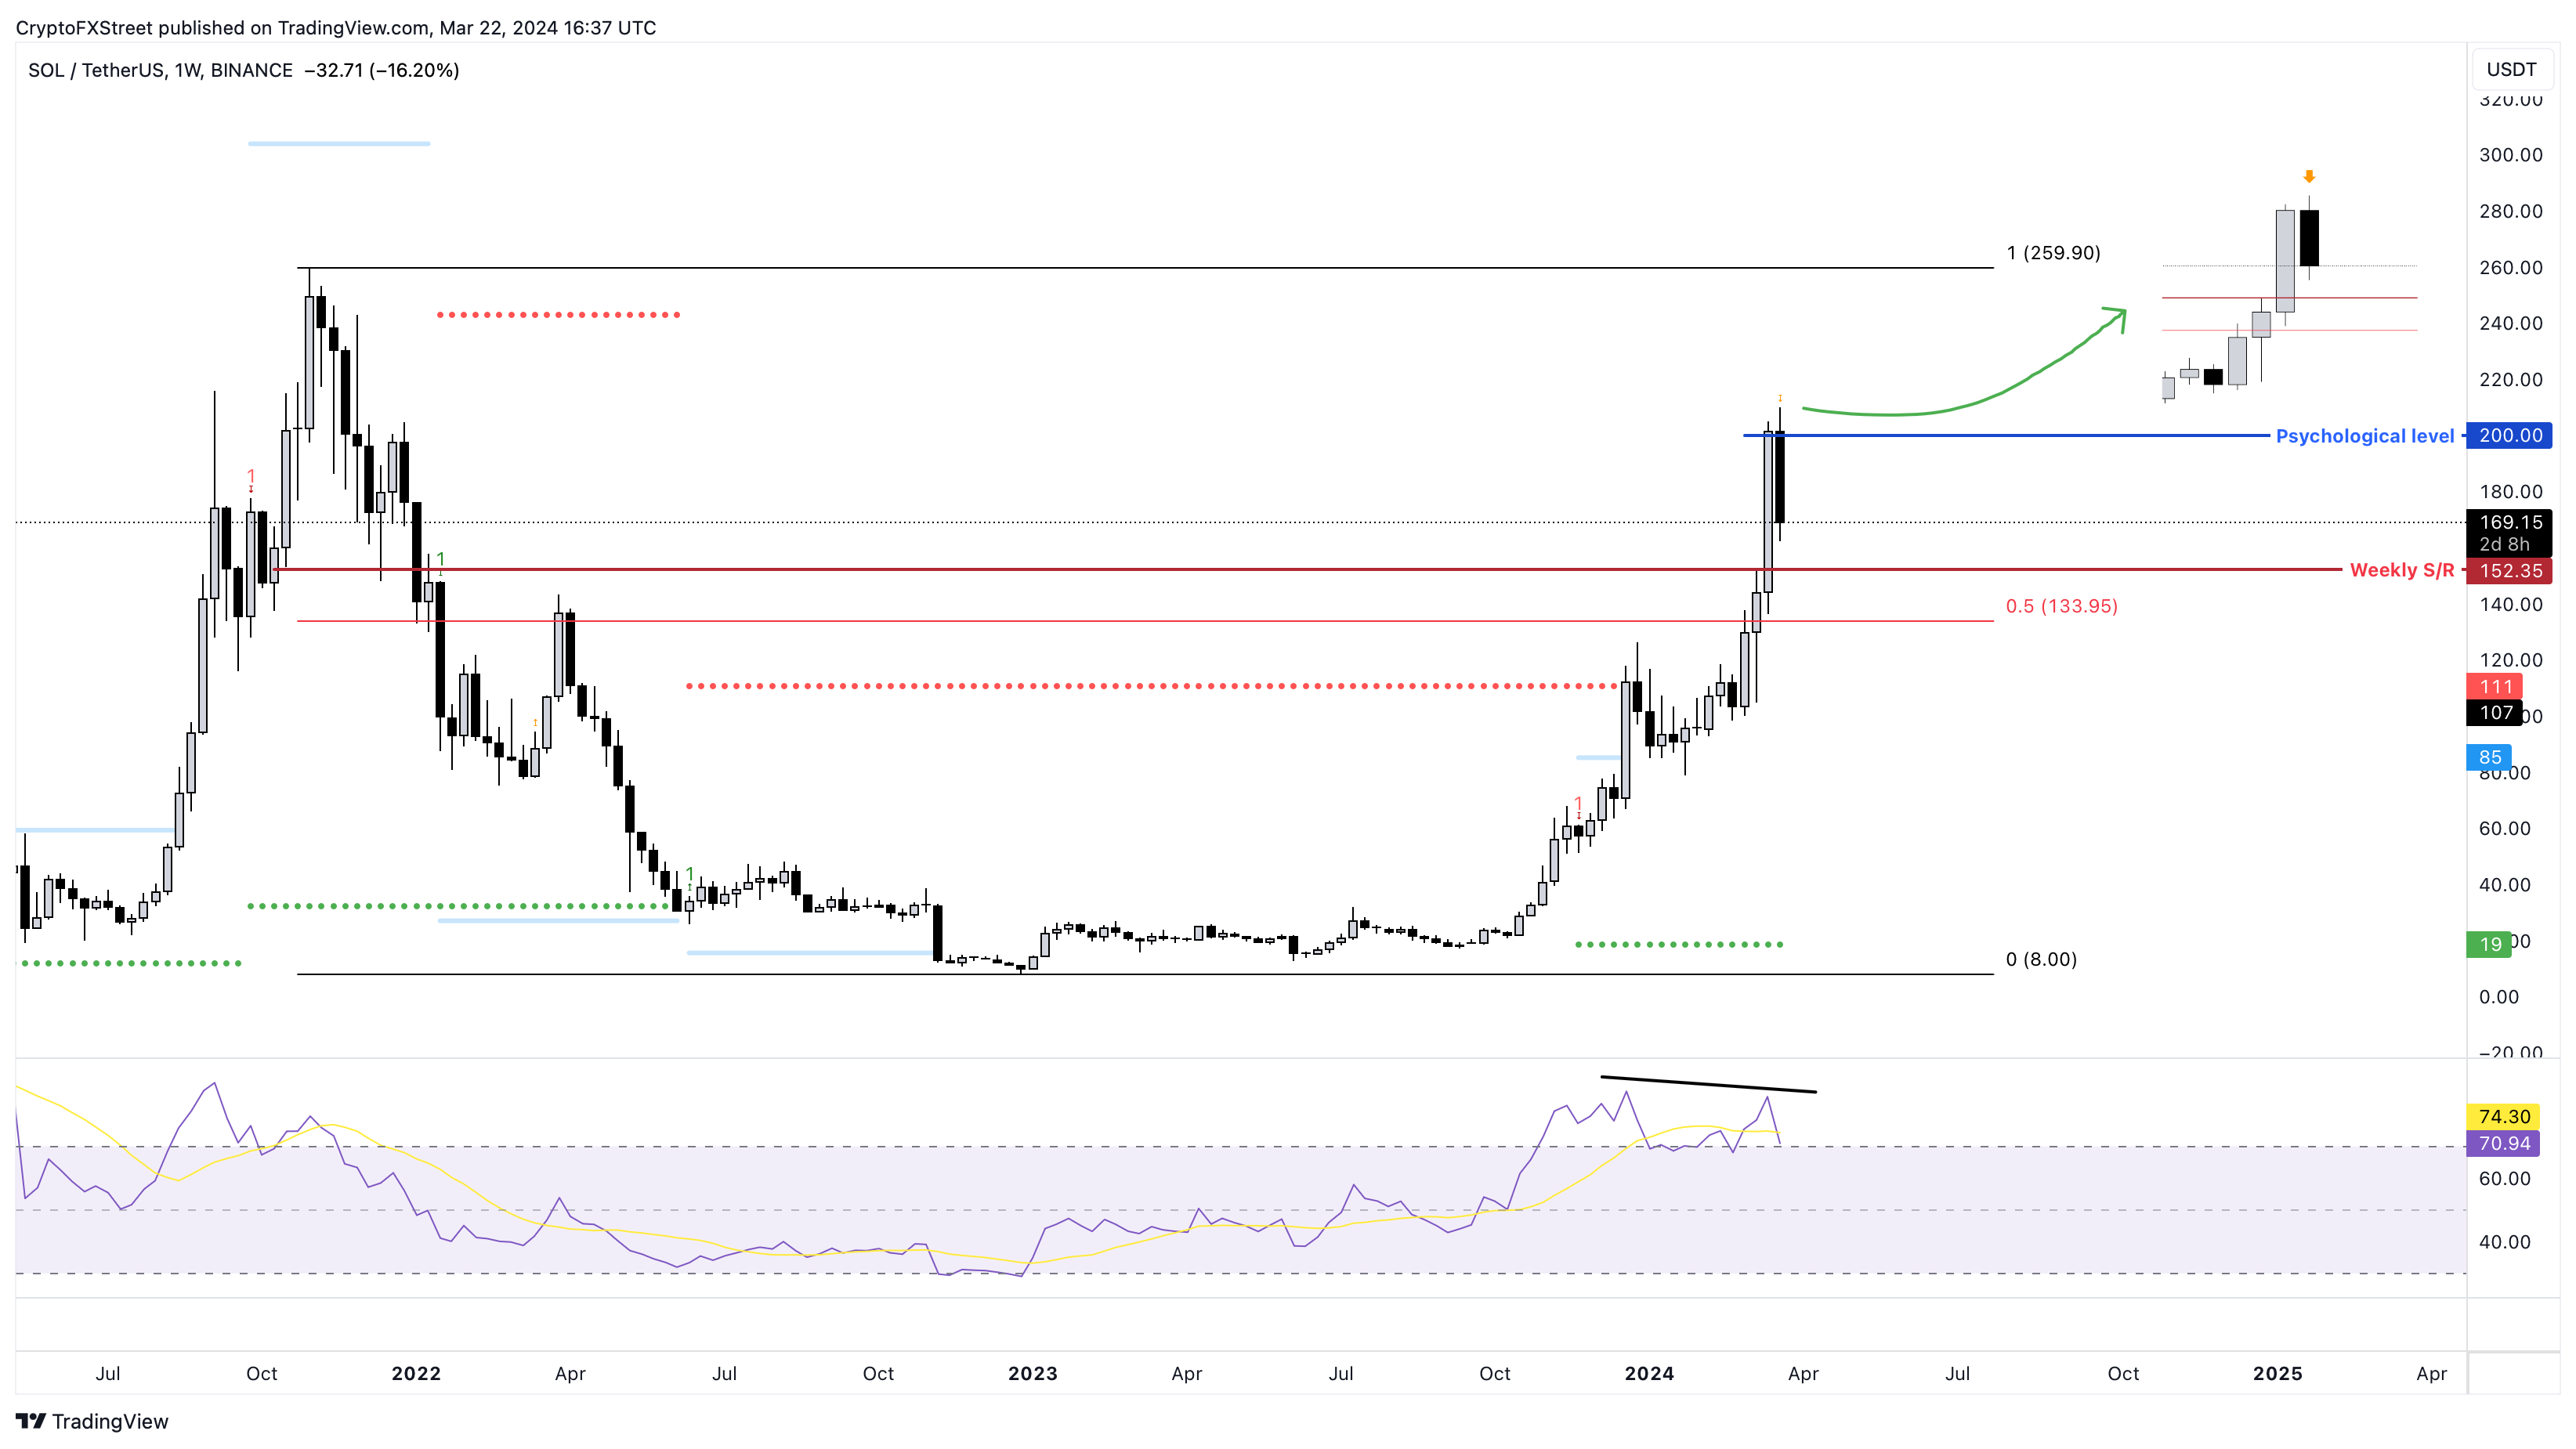
SOL/USDT 1-week chart
On the other hand, if Solana price flips the $200 psychological level prematurely, the chances of an uptrend continuation are high. However, if Bitcoin price continues to shed, then SOL could follow in its footsteps.
A decisive weekly candlestick close below $134 would suggest a potential shift in trend. This development could attract weak hands to sell their holdings. If the panic sell-off has enough strength to push Solana price to produce a weekly close below $100, it would invalidate the bullish outlook. In such a case, Solana price could crash 11% and revisit the $89 support level.
Also read: Slerf appeals for donors to make presale investors whole for the lost $10 million
Author

Akash Girimath
FXStreet
Akash Girimath is a Mechanical Engineer interested in the chaos of the financial markets. Trying to make sense of this convoluted yet fascinating space, he switched his engineering job to become a crypto reporter and analyst.




