Solana price positioned for new bull rally towards $275
- Solana price breaks out above bull flag, indicating uptrend continuation.
- Moving and holding above $220 is essential to continue bullish momentum.
- Failure to extend higher here could see new monthly lows.

Solana price has hugged the top of the Cloud (Senkou Span A) as its primary support level for the past week. The respect of Senkou Span A as support has resulted in Solana moving and closing above one of the two Ichimoku levels necessary to confirm a new uptrend.
Solana price must close above the $220 value area before testing $275
Solana price is up against its primary and final Ichimoku resistance level on the daily Ichimoku chart. The Kijun-Sen within the Ichimoku system represents medium-term support and resistance and is the primary level for intraday and intraweek trading strategies within the Ichimoku system. The Kijun-Sen at the $220 level is precisely where Solana finds itself pushing against.
A daily close of Solana price above $220 provides more protection from near-term downside movement than it does upside potential for a couple of reasons. First, a close above the Kijun-Sen would convert the Kijun-Sen from a resistance level to support. Second, because retests of breakouts from bull flags are extremely common, the combination of the Kijun-Sen and top of the bull flag create a double-support structure.
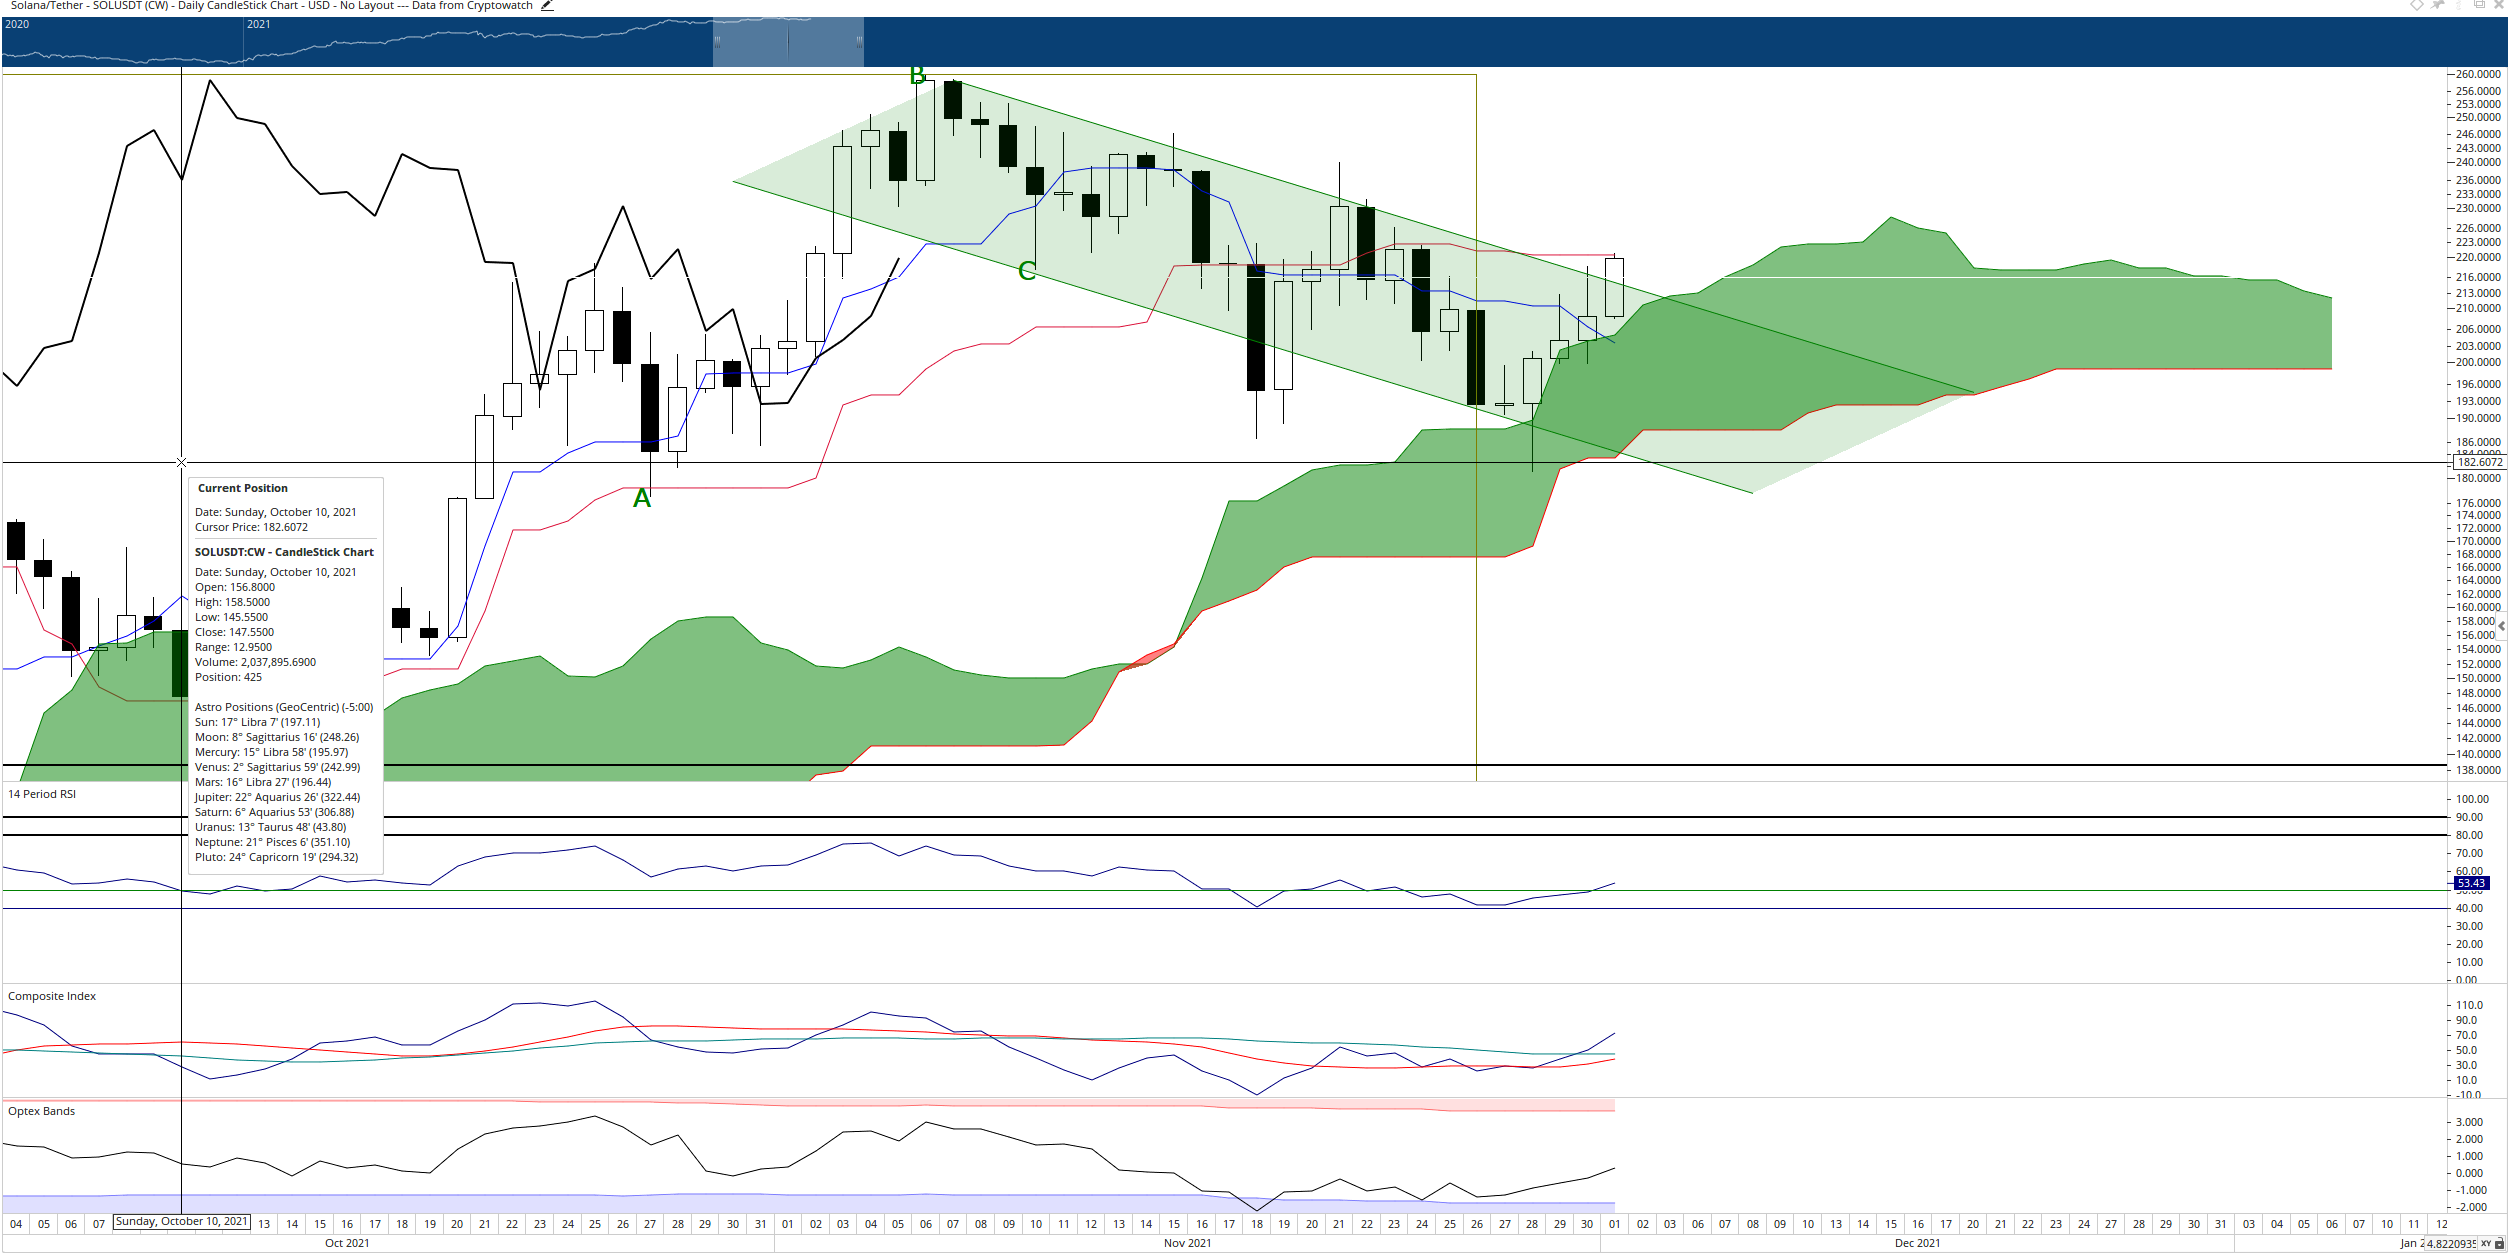
SOL/USDT Daily Ichimoku Chart
Solana price does have downside risks. The Composite Index has created a high above the previous high peak on November 21st, while the candlestick chart shows the current daily high is lower than the November 21st high. This creates a condition known as hidden bearish divergence – a warning that the current drive higher may fail.
It is essential that Solana price close above the November 21st open of $217, or the hidden bearish divergence may push Solana back into the bull flag and likely even lower to test the bottom of the Cloud (Senkou Span B) at $184.
Author

Jonathan Morgan
Independent Analyst
Jonathan has been working as an Independent future, forex, and cryptocurrency trader and analyst for 8 years. He also has been writing for the past 5 years.



