Solana price forms bear trap before SOL ascends toward $325
- Solana price is slowly planning a recovery after a bear trap has been formed.
- $209 will be a key level to watch as SOL must rise above it in order for a 54% rally to be on the radar.
- The Ethereum-killer will find reliable support at $185 if selling pressure increases.

Solana price has been steadily trending upwards since mid-September, providing a promising bullish outlook. However, the Ethereum killer recently formed a bear trap as it sliced below the governing technical pattern’s lower boundary, confusing forecasts. Once SOL manages to reclaim $209, the altcoin could skyrocket 54%.
Solana price needs to reclaim critical level
Solana price has printed an ascending parallel channel on the daily chart, suggesting an optimistic outlook. On November 26, SOL sliced below the prevailing chart pattern’s downside trend line, indicating that the uptrend is in jeopardy. However, technical indicators suggest that this recent low only formed a bear trap.
While Solana price fell to a swing low at $182, the Relative Strength Index (RSI) failed to reach a new low – indicating a bullish divergence. This trading signal suggests that the bears are losing control over the market, and that the bulls are ready to take over, marking the end of a temporary downtrend.
The prevailing chart pattern suggests that Solana price could tag the upper boundary and 127.2% Fibonacci extension level as its next bullish target at $325, marking a 54% climb.
In order for the bulls to execute a recovery, Solana price must reclaim the the lower boundary of the parallel channel as support at the 78.6% Fibonacci retracement level at $209, coinciding with the 21-day Simple Moving Average (SMA).
Solana price will battle additional hurdles at the 50-day SMA at $225, corresponding to the resistance line given by the Momentum Reversal Indicator (MRI). The final hurdle appears to be at $259, the altcoin’s all-time high, which sits near the middle boundary of the governing technical pattern before SOL aims for the optimistic target at $325.
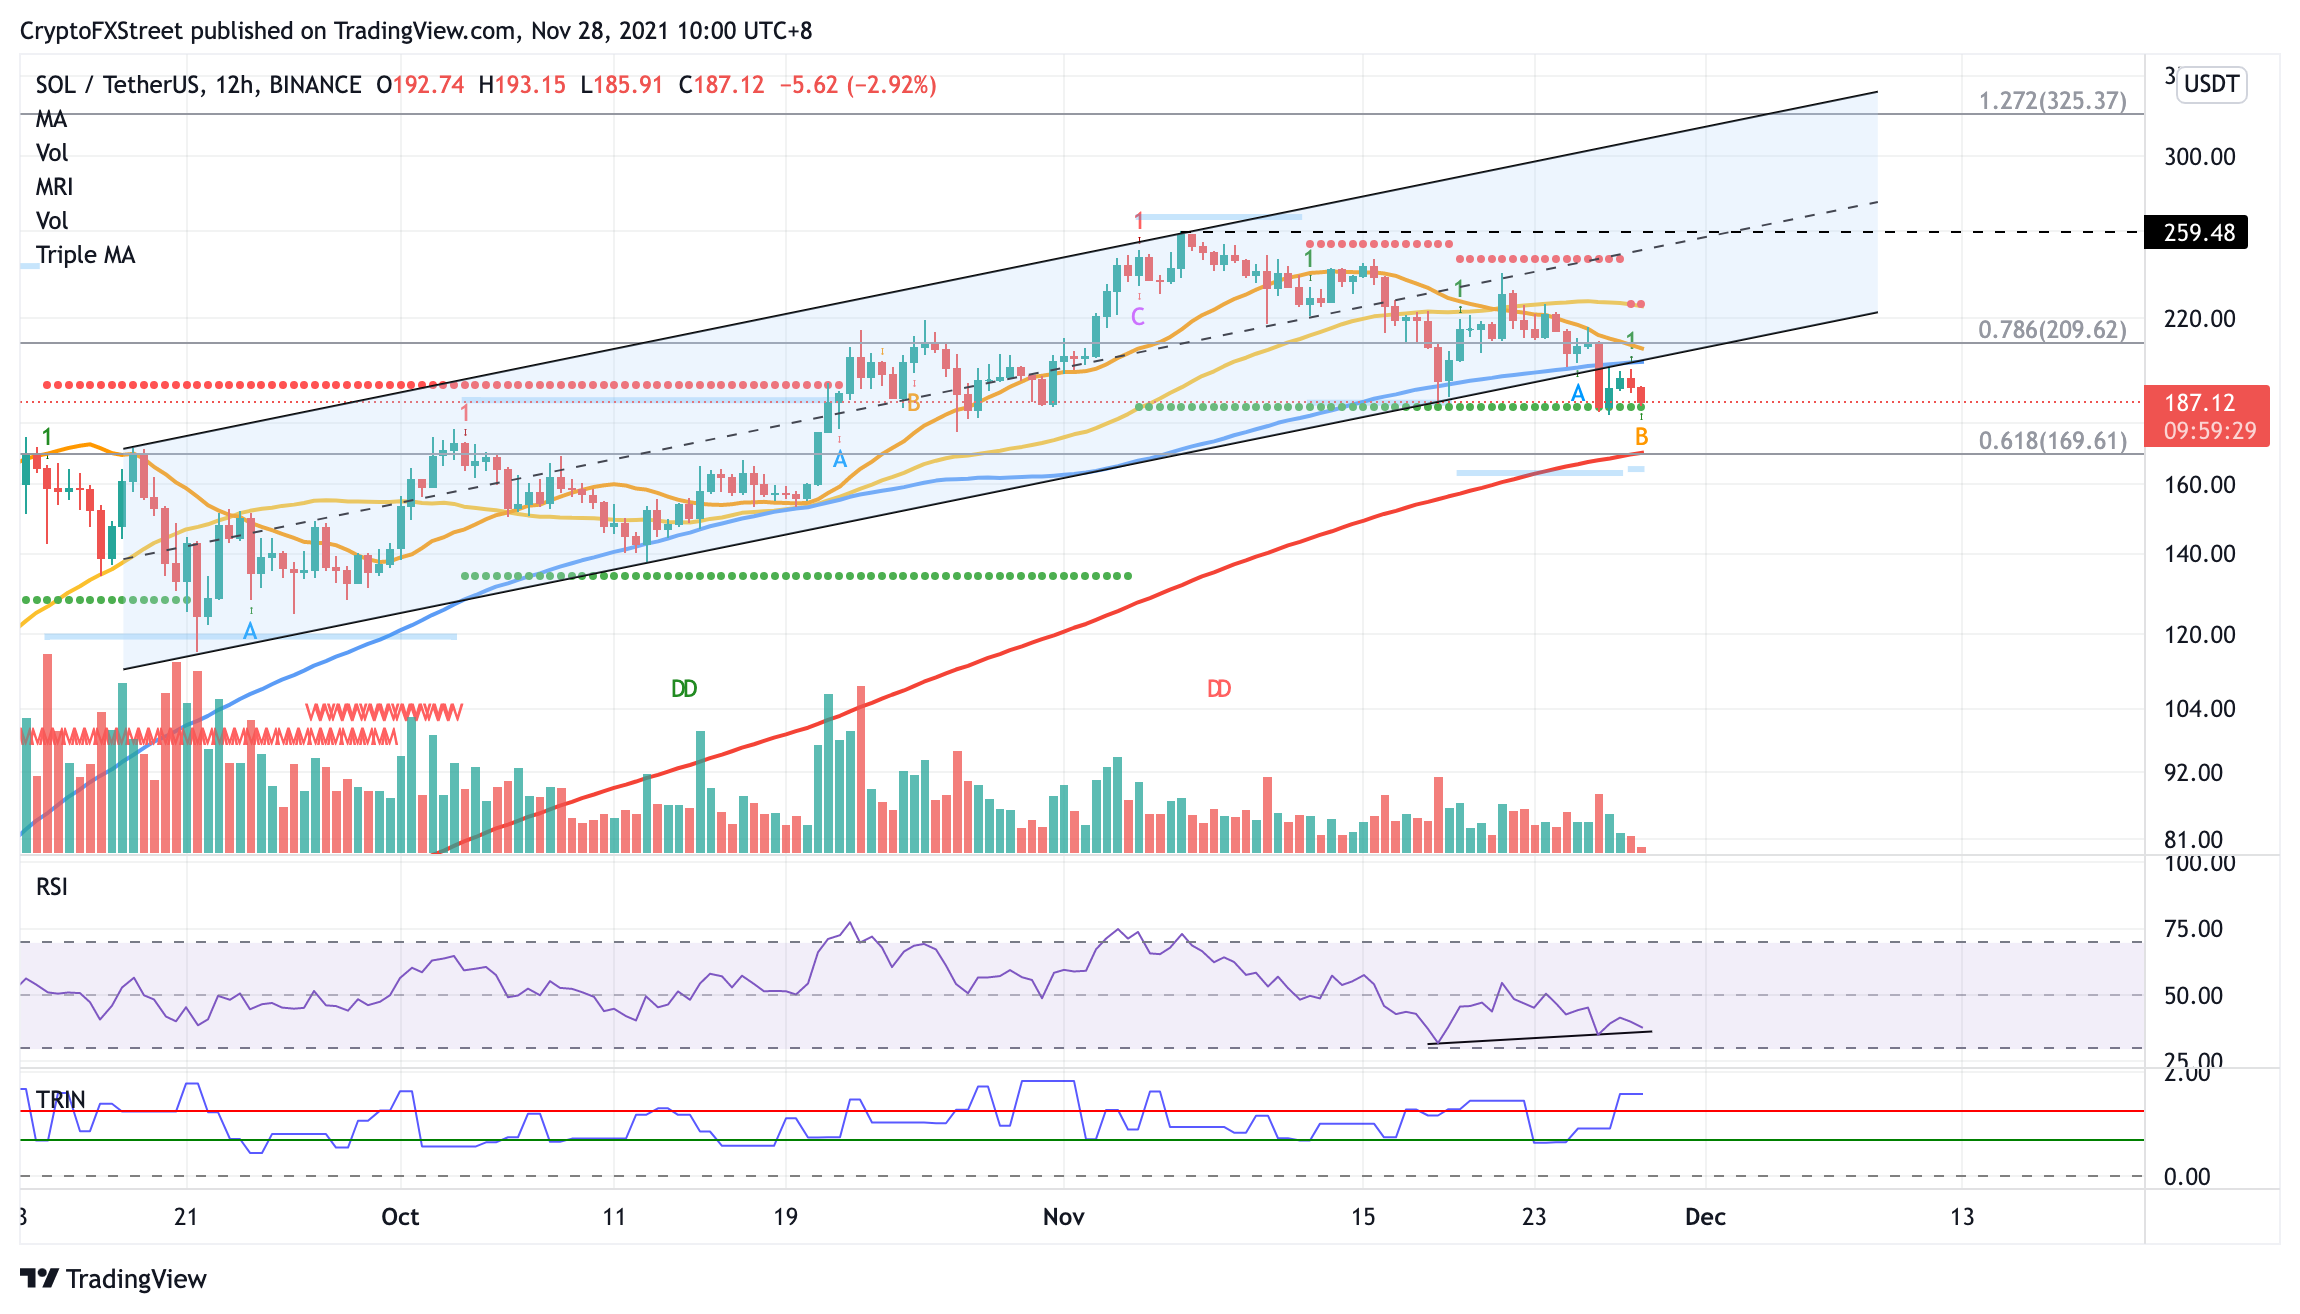
SOL/USDT daily chart
The MRI flashed a bottom signal on the second November 27 candle, adding credence to the bullish outlook.
However, if the bears decide to take back control, Solana price will discover an immediate foothold at $185, the November 18 low, corresponding to the MRI’s support line. An additional line of defense will appear at $169, where the 200-day SMA and 61.8% Fibonacci retracement level reside.
Author

Sarah Tran
Independent Analyst
Sarah has closely followed the growth of blockchain technology and its adoption since 2016.


