Solana Price Forecast: SOL hovers above $150 as interest in building on its blockchain doubles in 2024
- Solana declines slightly on Thursday, trading at $152.26.
- Builder interest on Solana blockchain has doubled in 2024, according to an a16z report.
- The number of active addresses in the Solana network has also increased sharply.

Solana (SOL) hovers around the $150 level on Thursday. Recent gains in the native token of the Solana blockchain are likely catalyzed by rising investor and developer interest.
A16z’s State of crypto report released on Wednesday, October 16 shows a spike in addresses and web3 builders’ interest in Solana.
Solana could extend gains as it draws interest from traders and builders
Crypto’s monthly active addresses shot to an all-time high of 220 million in September 2024. Of this number, Solana and rising activity on its blockchain accounted for about 100 million active addresses.
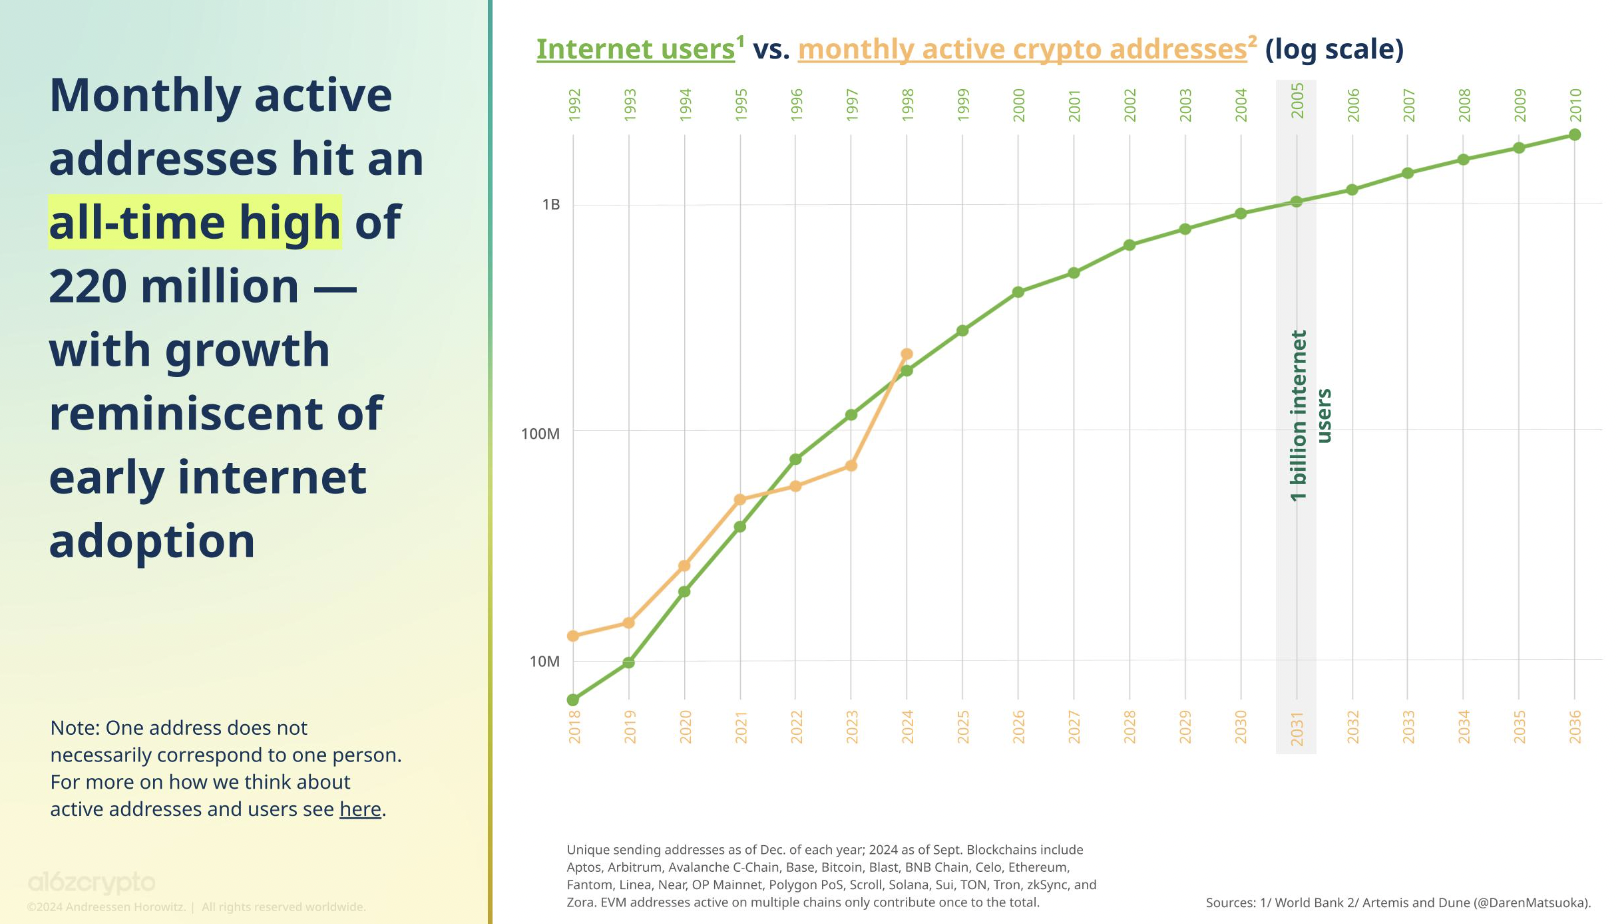
Crypto active addresses as seen in a16zcrypto report
The Builder Energy dashboard that lists developer interest in building applications on different blockchains in the crypto ecosystem tracks how lucrative Solana is to web3 builders. The report shows that the SOL blockchain saw the biggest change in the total share of builder interest, up to 11.2% in 2024, from 5.1% in 2023.
Solana witnessed several meme coin launches in 2024, this contributed to the “meme coin” cycle this year. In Q1 2024, the top-performing crypto token category was meme coins. This sector continues to attract users to the SOL blockchain and ecosystem.
Solana Price Forecast: SOL could rally 12%, test key resistance
Solana is in an upward trend as seen in the SOL/USDT daily chart. Bullish catalysts could push SOL higher to test resistance at the lower boundary of the Fair Value Gap (FVG) between $169.43 and $171.61. SOL could gain 11.44% in its rally to the resistance at $169.43. This level has not been tested since August 2, 2024.
The Moving Average Convergence Divergence (MACD), a momentum indicator, shows green histogram bars above the neutral line, meaning there is underlying positive momentum in SOL price.
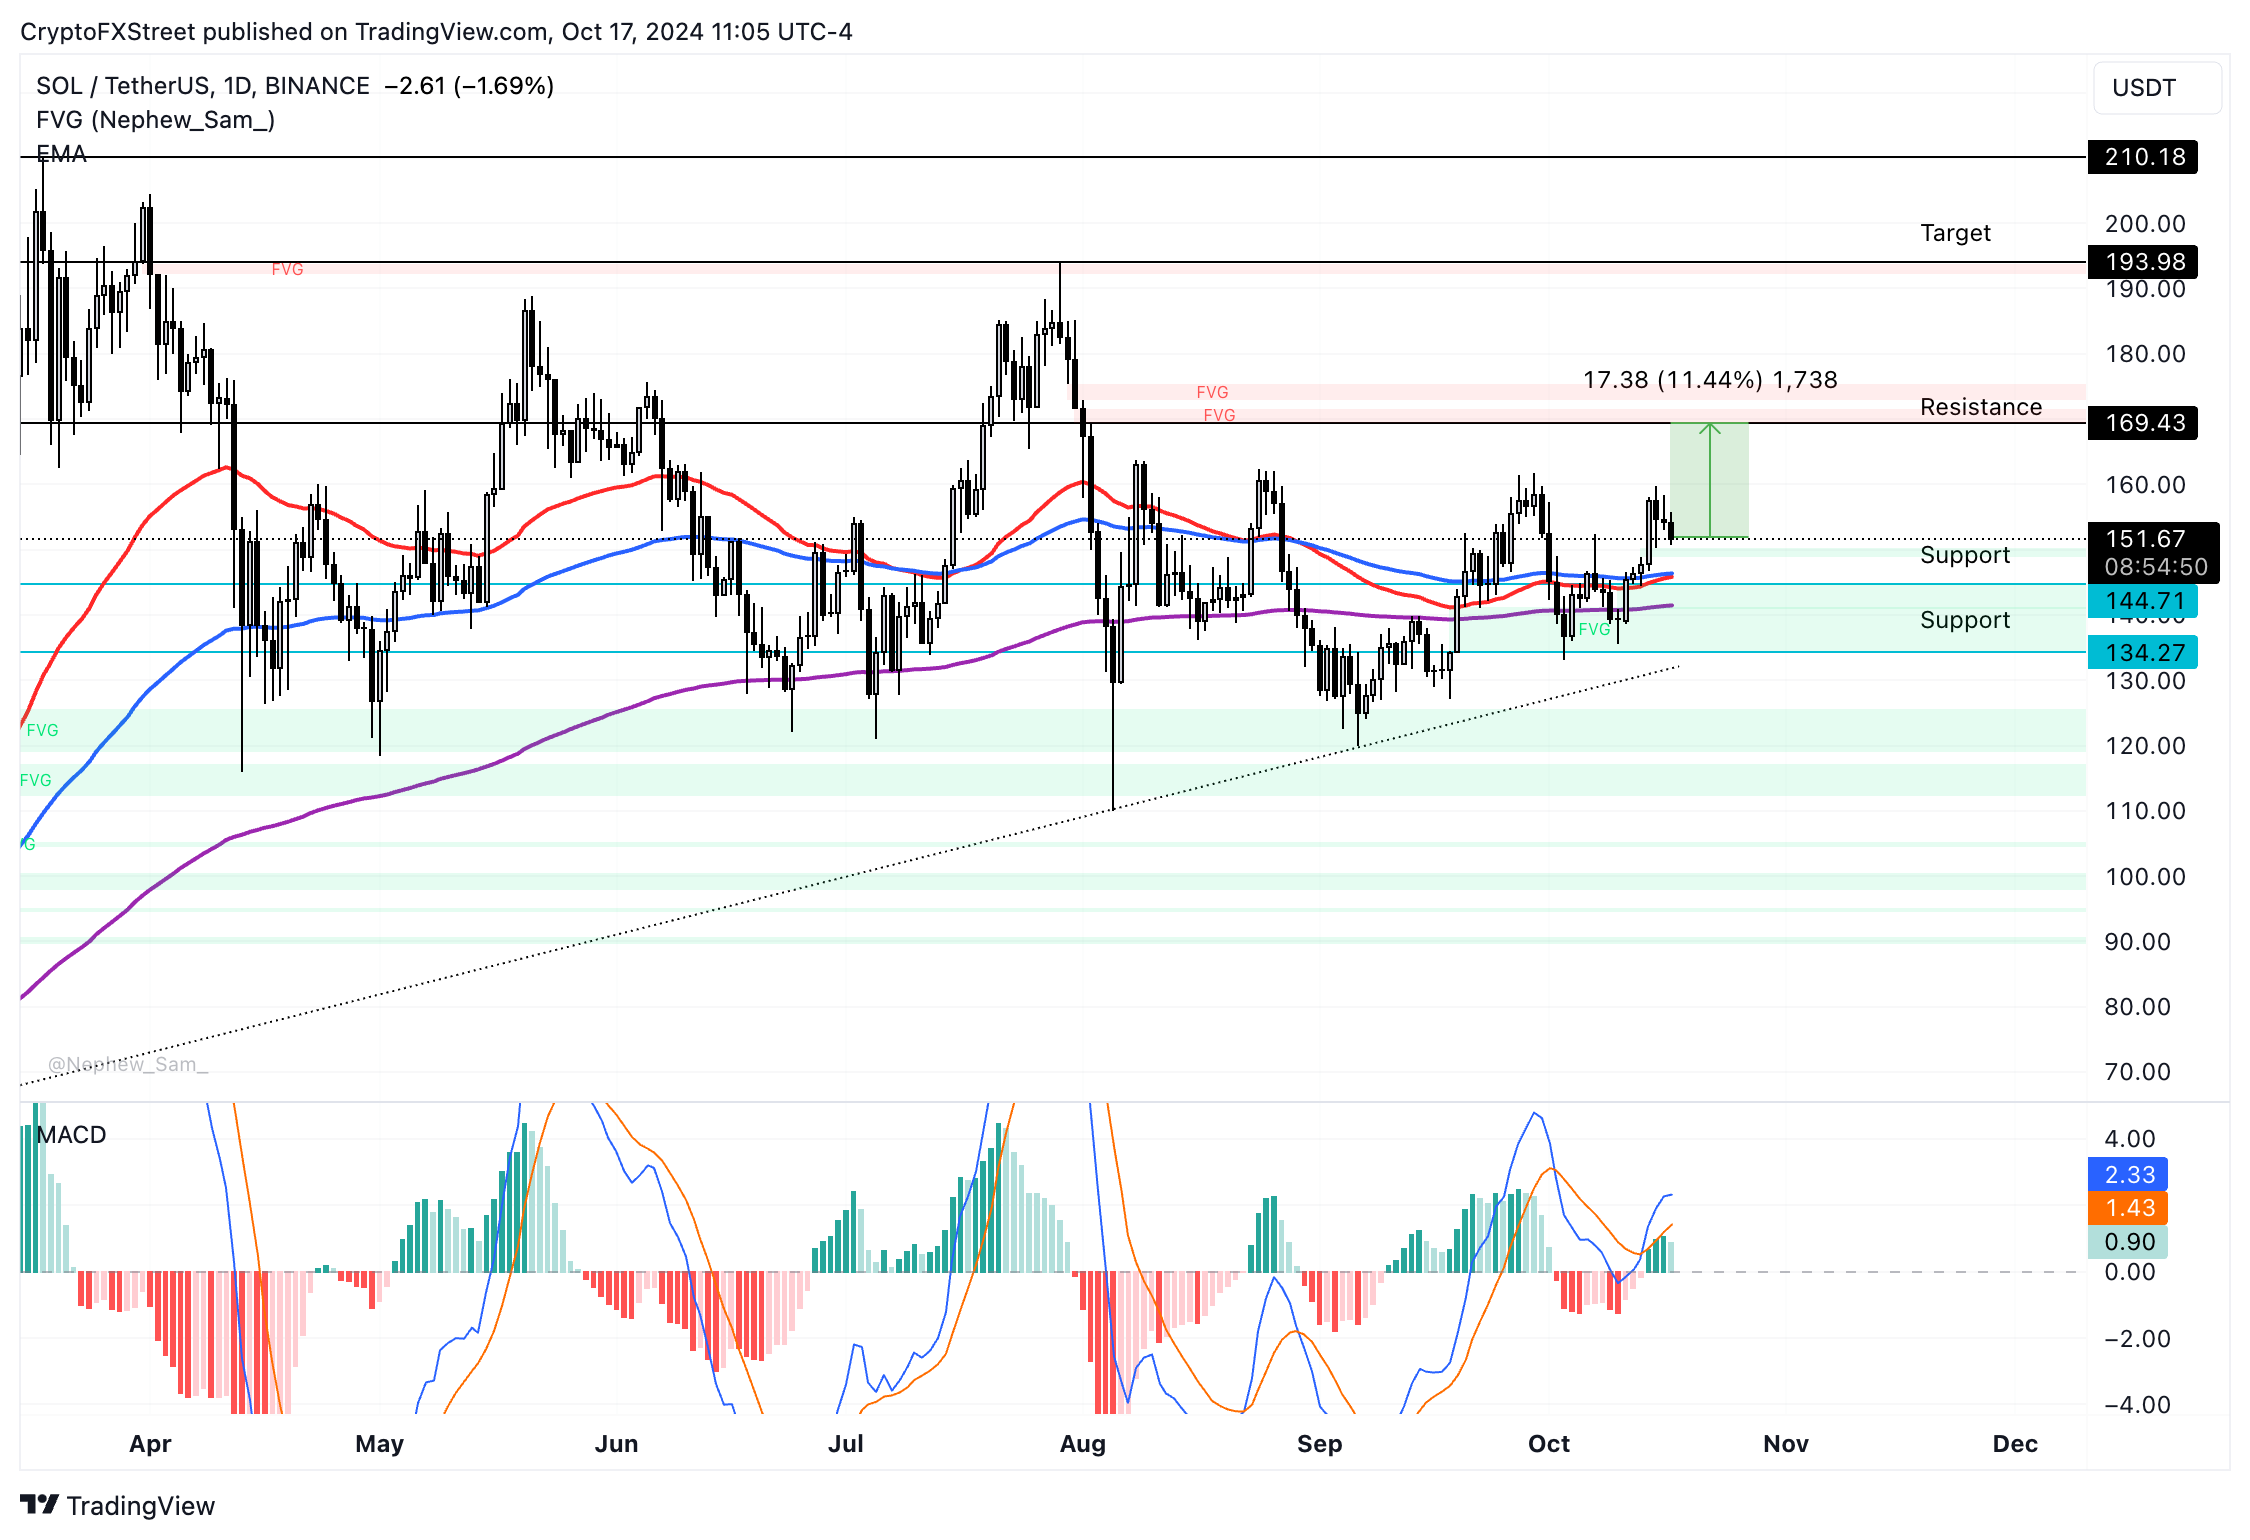
SOL/USDT daily chart
A daily candlestick close under the 50-day Exponential Moving Average (EMA) at $146.35 could invalidate the bullish thesis. SOL could sweep support at $134.27, the September 19 low for SOL. Traders need to watch the MACD indicator closely. If consecutive histogram bars keep getting shorter, SOL is likely to note a reversal in its trend.
Author

Ekta Mourya
FXStreet
Ekta Mourya has extensive experience in fundamental and on-chain analysis, particularly focused on impact of macroeconomics and central bank policies on cryptocurrencies.


