Solana Price Forecast: SOL gears up to test $172 resistance
Solana price today: $154.55
- Solana price gains slightly on Wednesday, hovers around $155.
- Solana recently shared details of its developer bootcamp.
- SOL could test $160 resistance and rally toward the August peak of $172.91.
Solana (SOL) gains on Wednesday, trades above $154 at the time of writing. SOL token has traded within a range between the March 18 peak of $210.18 and the August 5 low of $110 for six consecutive months.
SOL faces key resistance at $172.89, the altcoin’s August peak and a resistance level that remains untested for over two and a half months.
Solana gears up for gains amid influx of stablecoins to exchanges
Data from on-chain tracker Whale Alerts shows a large volume inflow of stablecoins like USD Tether (USDT) to centralized exchange platform Binance. Typically, stablecoin inflows represent a rise in demand from retail investors. Stablecoins are used as fiat on and off ramps across exchanges, therefore, transfers hold significance for price action.
Alongside the stablecoin inflows, Solana makes progress toward the $172.89 level, the August peak and key resistance level. The $165 level is another key resistance on SOL’s path to the August 2024 high.
On-chain indicators, active addresses and new addresses on the SOL blockchain continue to climb, according to data from the Block. Throughout October 2024, both metrics have climbed, signaling higher demand and activity on the Solana blockchain.
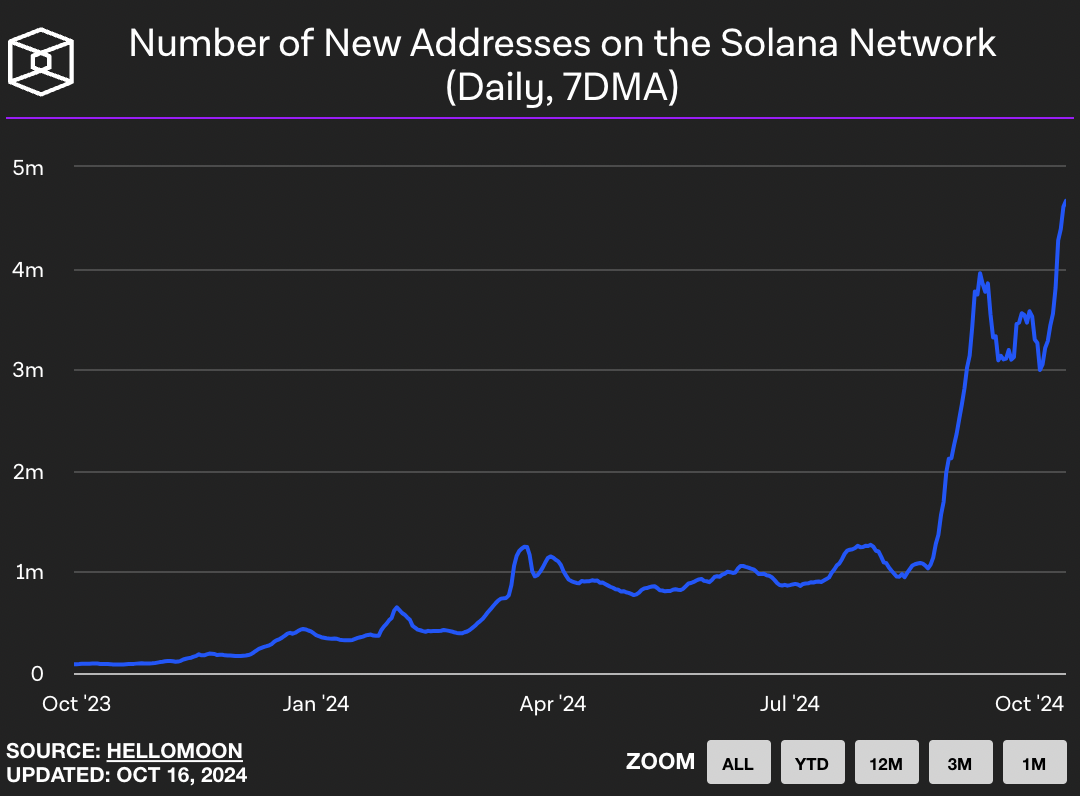
Number of new addresses on the Solana network
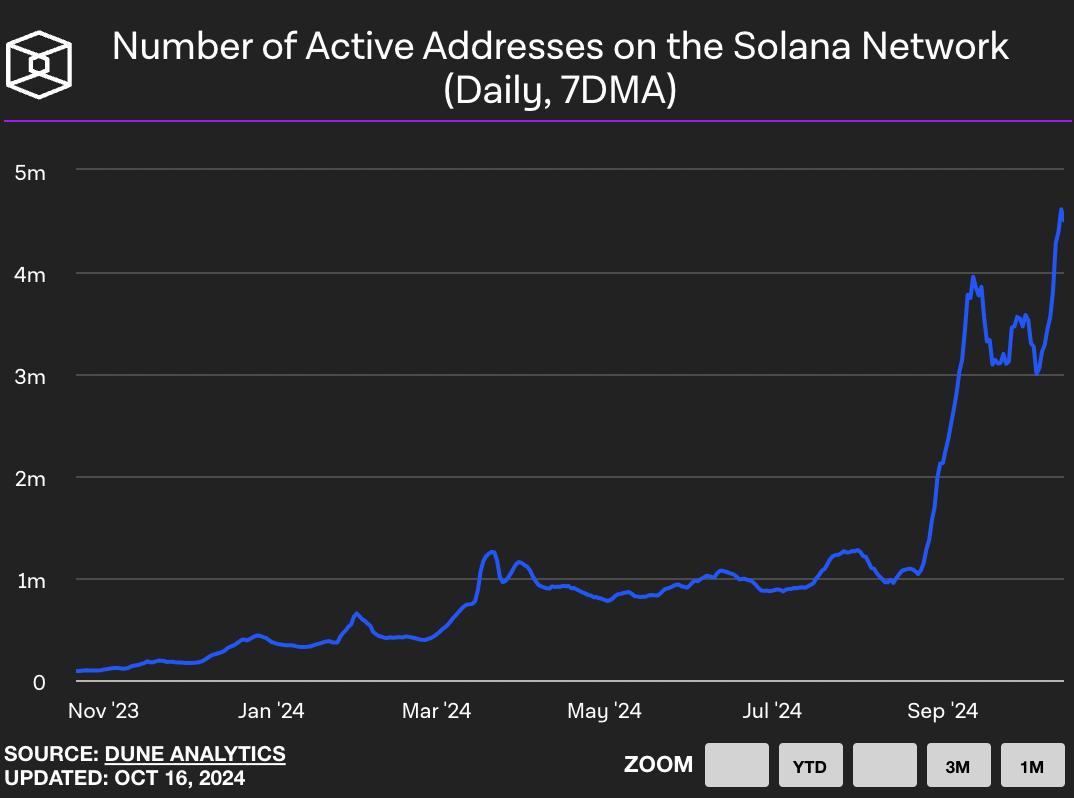
Number of active addresses on the Solana network
Solana Price Forecast: SOL eyes nearly 12% gain to August peak
Solana has been in an uptrend since October 2023. In the last six months, however, SOL formed lower highs and lower lows as seen in the SOL/USDT daily chart. SOL could gain 11.71% and climb toward resistance and the August peak of $172.91. SOL could face resistance at $165, a key psychological barrier for the altcoin.
The Moving Average Convergence Divergence (MACD) shows green histogram bars above the neutral line. SOL price trend has an underlying positive momentum, according to this momentum indicator.
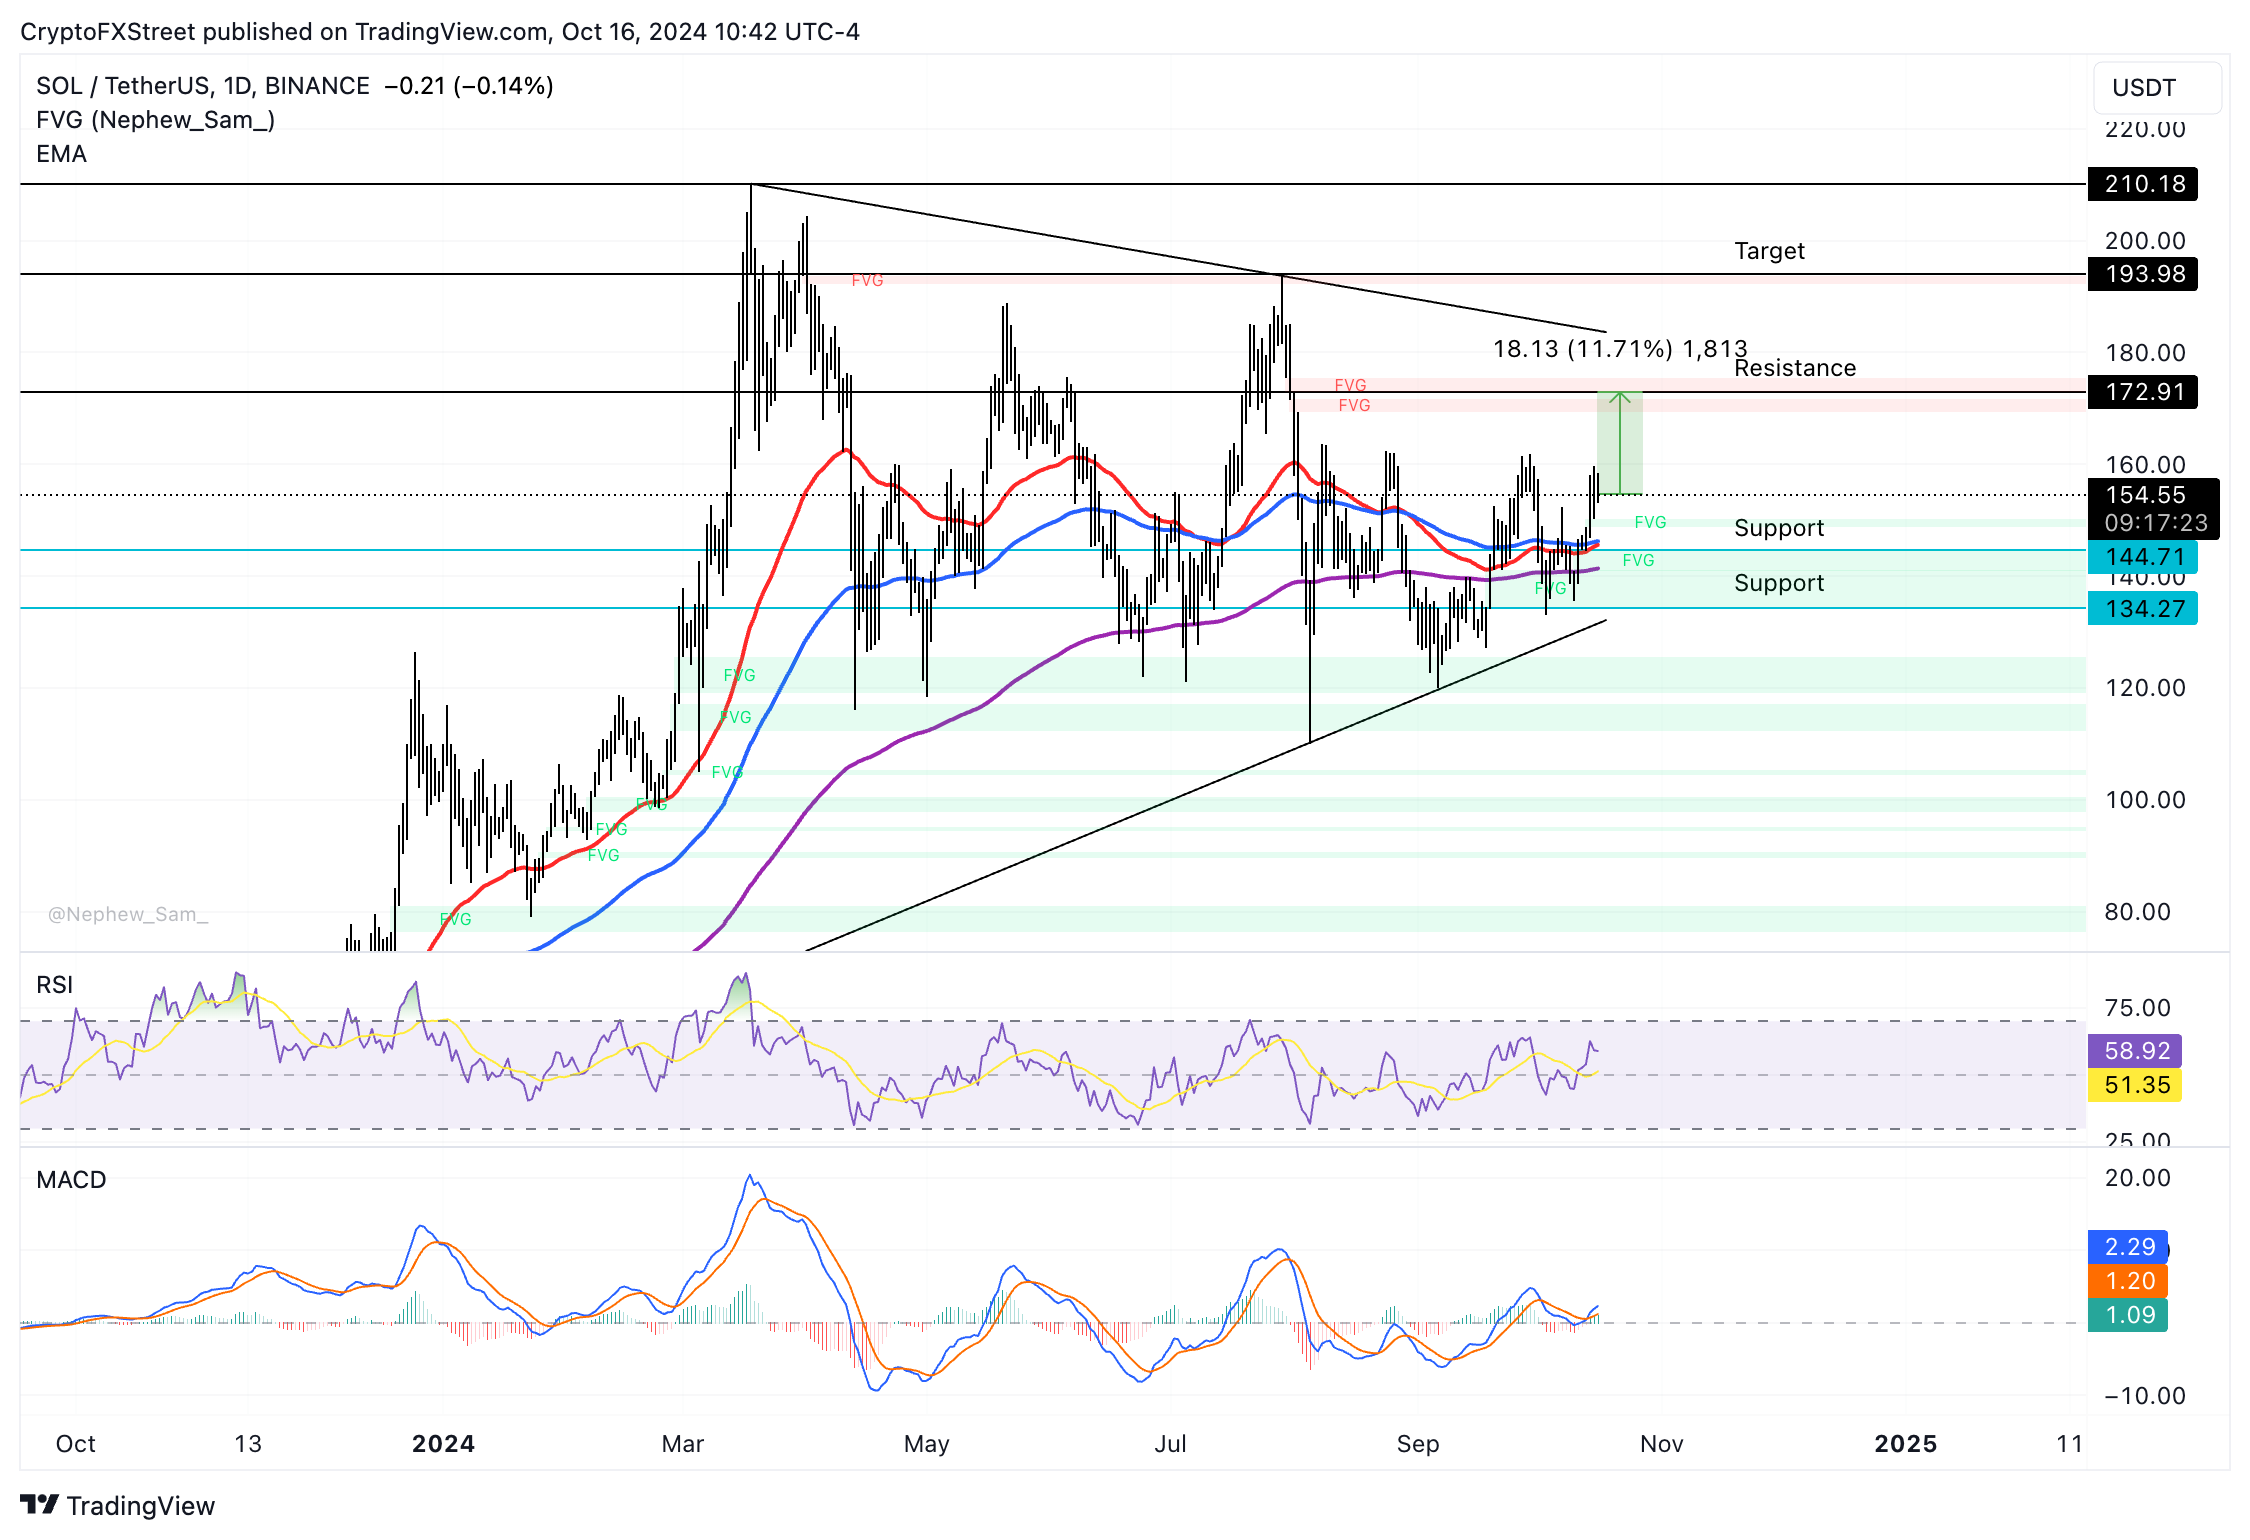
SOL/USDT daily chart
The Fair Value Gap (FVG) between $148.86 and $150.31 is a key support level. SOL could sweep liquidity in this zone, if there is a correction. Another key technical indicator, the Relative Strength Index (RSI), reads 59 and is sloping downward on the daily chart. This means SOL could suffer a correction although it remains above the neutral level.
Author

Ekta Mourya
FXStreet
Ekta Mourya has extensive experience in fundamental and on-chain analysis, particularly focused on impact of macroeconomics and central bank policies on cryptocurrencies.


