Solana Price Forecast: SOL eyes 13% gain amid bullish on-chain data

Solana price today: $144.10
- Solana gains nearly 4% on Friday, the Ethereum-alternative token trades at $144.10.
- In the past week, Solana gained 5.42%, according to data from TradingView.
- SOL could extend gains by 13% to hit August 8 high of $163.70.
Solana (SOL) has been in an upward trend since October 2023. The native token of the Solana blockchain has gained consistently, riding on the meme coin ecosystem’s growth in SOL. On-chain metrics like new addresses and active addresses in the Solana network have observed an increase, as of October 9, 2024.
Solana on-chain metrics signal SOL price growth
Solana network’s active addresses and new addresses have shown an increase, according to data from The Block. About 3.44 million addresses are active, as of October 9, as seen in the chart below. This marks an increase from a low of 3.06 million on October 6.
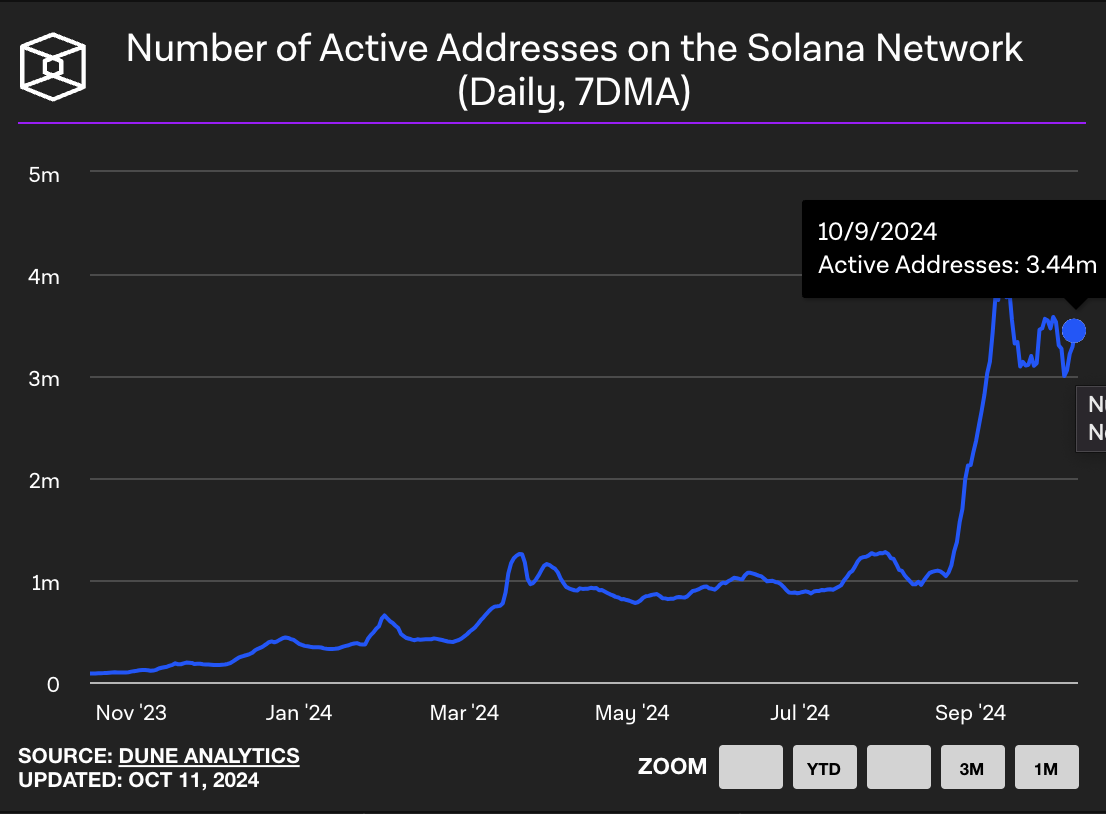
Number of active addresses on the Solana Network
Transactions on the Solana network climbed consistently in October, up to 38.88 million on October 10, 2024. Increase in transactions is a sign of higher demand among market participants and likely higher adoption among traders.
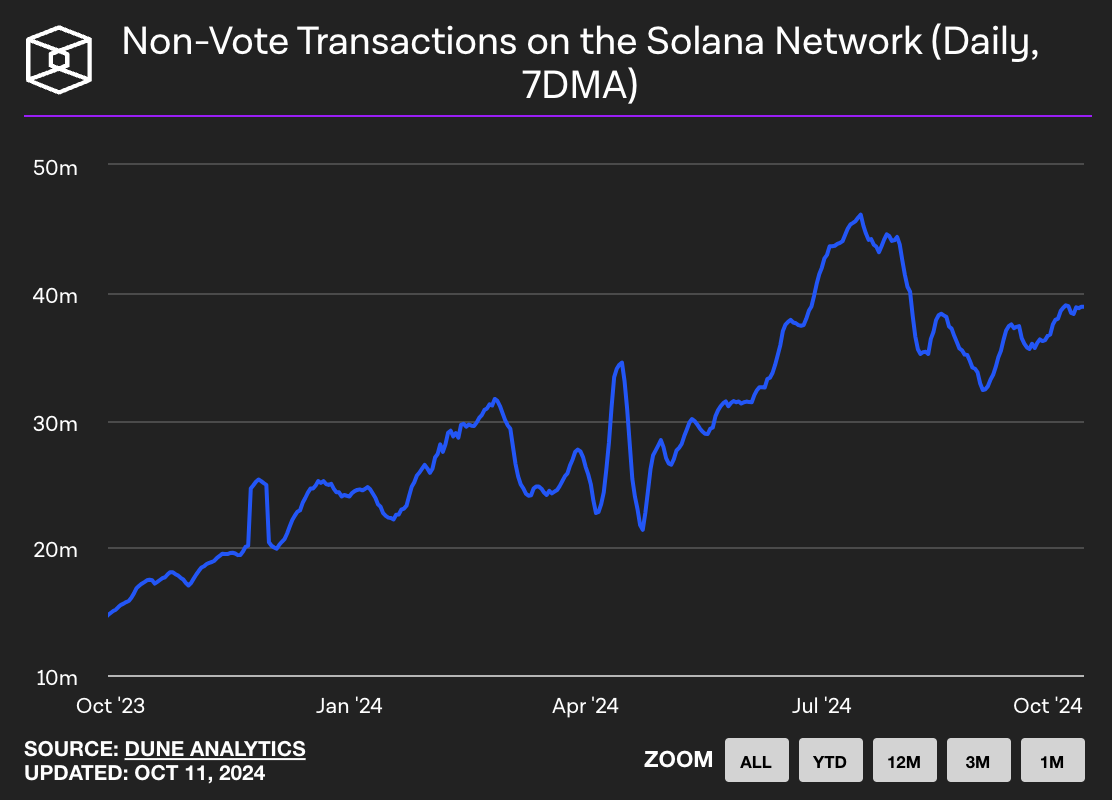
Non-vote transactions on the Solana Network
Solana announced a developer bootcamp to introduce devs to its blockchain and power projects on the SOL chain.
Introducing the Solana Developer Bootcamp: your one-stop shop to go from zero blockchain knowledge to advanced Solana development.
— Solana (@solana) October 10, 2024
- 13 hands-on projects
- 100% free
- For beginner and advanced devs
Dive in pic.twitter.com/GwFyhNJ98h
Another bullish metric is the volume of decentralized exchanges on Solana. Data from Syndica shows that Solana’s spot decentralized exchange volumes have exploded to $480 billion year-to-date (YTD) in 2024, surpassing the annual volumes of 2022 and 2023. It marks a 22X increase compared to 2022 and 11X increase compared to 2023.
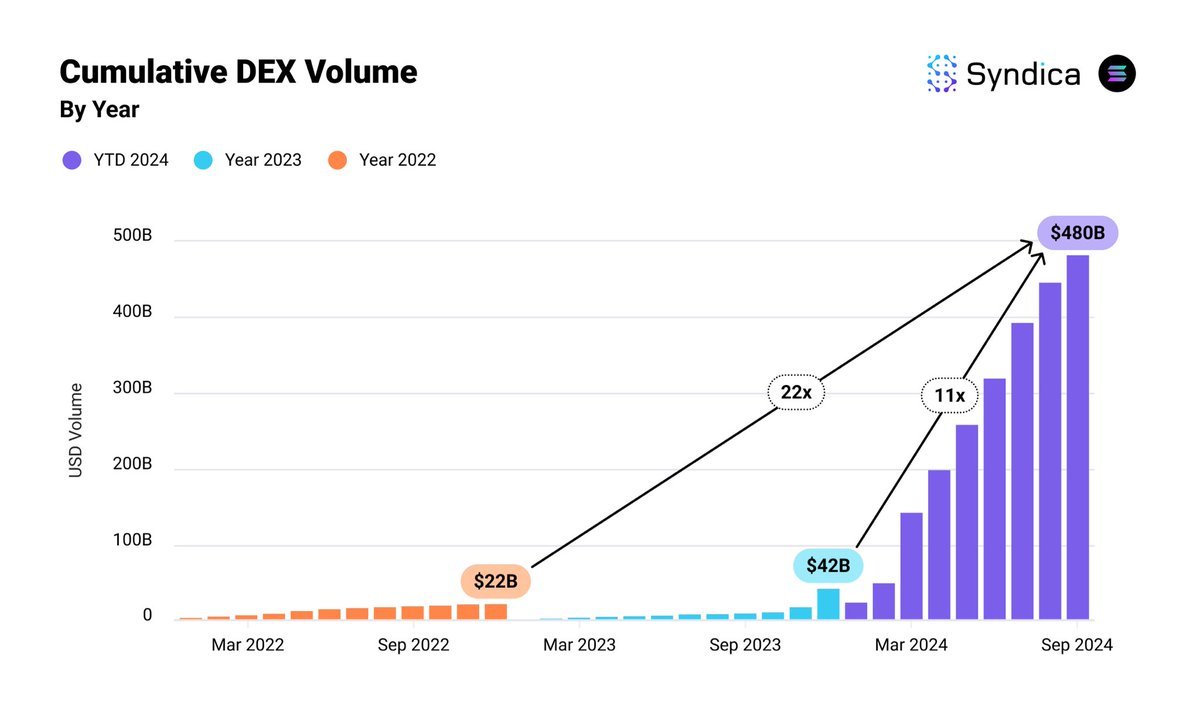
Solana DEX Volume
Solana Price Forecast: SOL could gain 13%
Solana started its upward trend in October 2023. Since then the altcoin has climbed. SOL noted largely range bound price action between the upper boundary of $163.70 and the lower boundary of $110 since August 5.
SOL could extend gains by 13.6% and rally toward $163.70, facing resistance at the September 30 low of $151.73.
The Relative Strength Index (RSI) reads 50.38, hovering around the neutral level.
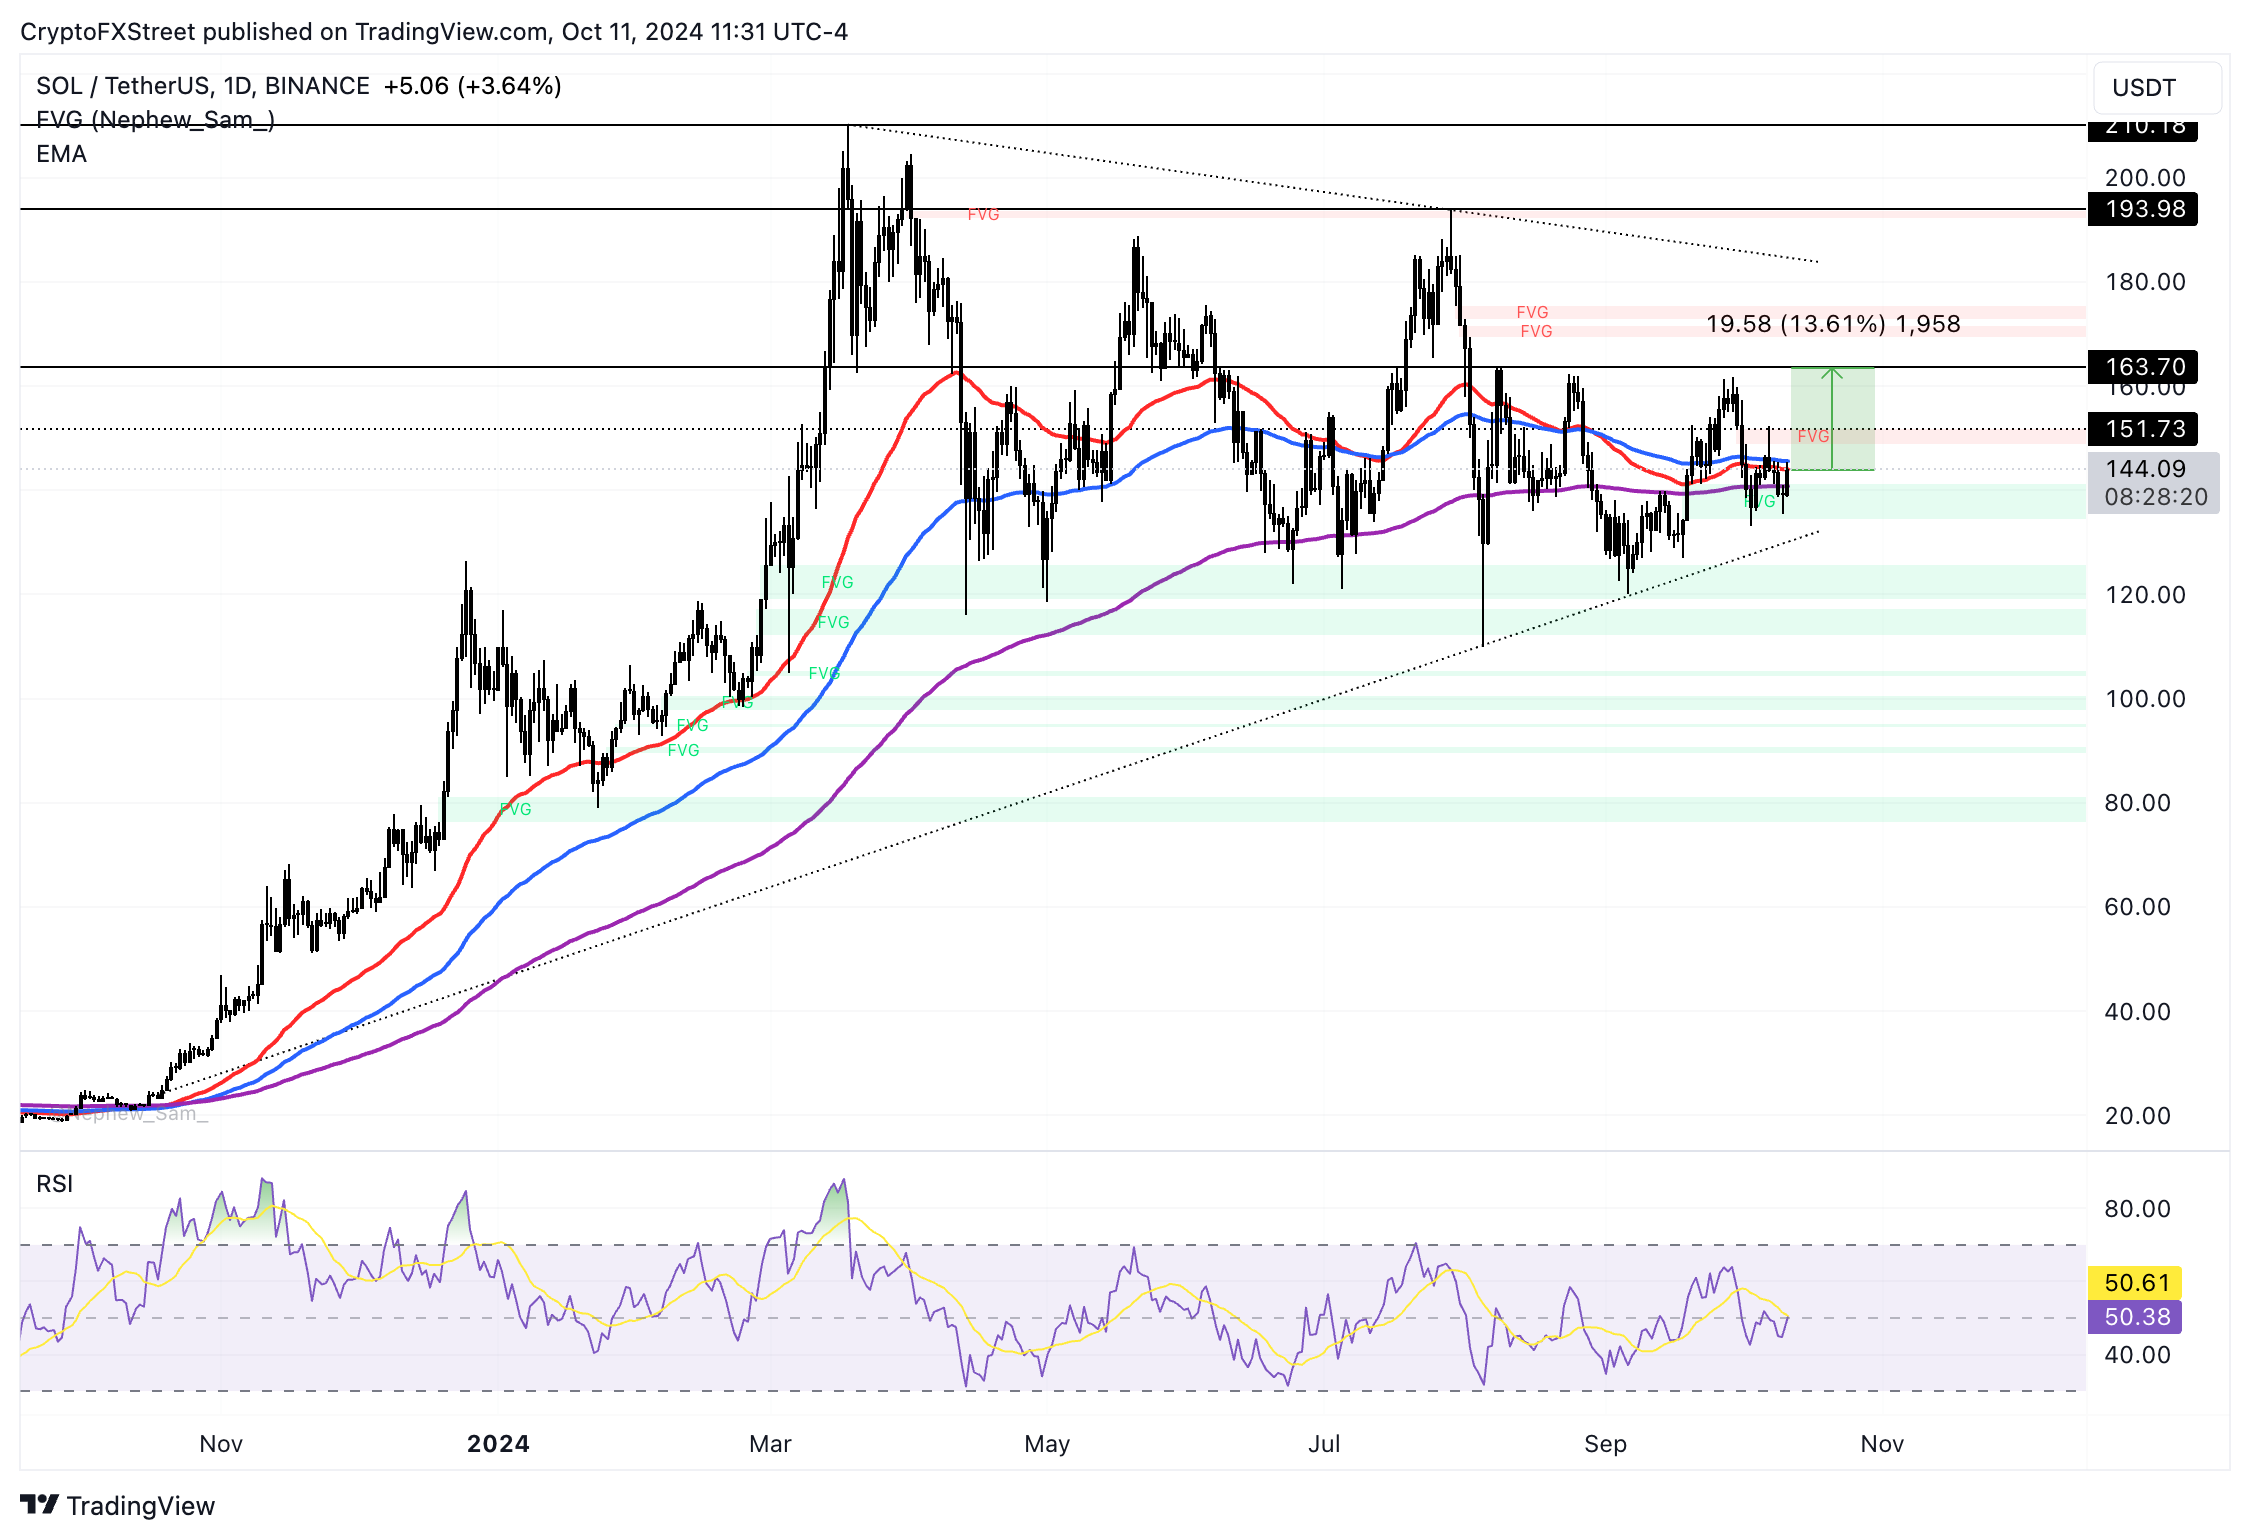
SOL/USDT daily chart
A daily candlestick close under October 10 low of $135.52 could invalidate the bullish thesis for Solana. SOL could sweep liquidity at the 200-day Exponential Moving Average (EMA) at $140.67.
Bitcoin, altcoins, stablecoins FAQs
Bitcoin is the largest cryptocurrency by market capitalization, a virtual currency designed to serve as money. This form of payment cannot be controlled by any one person, group, or entity, which eliminates the need for third-party participation during financial transactions.
Altcoins are any cryptocurrency apart from Bitcoin, but some also regard Ethereum as a non-altcoin because it is from these two cryptocurrencies that forking happens. If this is true, then Litecoin is the first altcoin, forked from the Bitcoin protocol and, therefore, an “improved” version of it.
Stablecoins are cryptocurrencies designed to have a stable price, with their value backed by a reserve of the asset it represents. To achieve this, the value of any one stablecoin is pegged to a commodity or financial instrument, such as the US Dollar (USD), with its supply regulated by an algorithm or demand. The main goal of stablecoins is to provide an on/off-ramp for investors willing to trade and invest in cryptocurrencies. Stablecoins also allow investors to store value since cryptocurrencies, in general, are subject to volatility.
Bitcoin dominance is the ratio of Bitcoin's market capitalization to the total market capitalization of all cryptocurrencies combined. It provides a clear picture of Bitcoin’s interest among investors. A high BTC dominance typically happens before and during a bull run, in which investors resort to investing in relatively stable and high market capitalization cryptocurrency like Bitcoin. A drop in BTC dominance usually means that investors are moving their capital and/or profits to altcoins in a quest for higher returns, which usually triggers an explosion of altcoin rallies.
Author

Ekta Mourya
FXStreet
Ekta Mourya has extensive experience in fundamental and on-chain analysis, particularly focused on impact of macroeconomics and central bank policies on cryptocurrencies.



