Solana Price Forecast: Assessing the possibility of squeezing more profit from SOL
- Solana price bounces off support at $11.00, but investors are yet to be convinced this is a sustainable trend.
- SOL could close the gap to the 50-day EMA at $34.74, but first, bulls must break resistance at $16 and $27.24, respectively.
- If the MACD fails to send a buy signal in the short term, investors should acclimatize to more losses soon.

Solana price is fighting a critical seller congestion zone at $16.00, a few days after confirming support at $11.00. Over the last three weeks, the smart contracts token has come under heavy selling pressure following its exposure to the fallen crypto giant FTX.
SOL was among the best-performing cryptocurrencies in 2021 when it rallied to tag a new record high at $259. The platform has, since its inception, been flaunted as a worthy Ethereum competitor.
However, the 2022 bear market run, coupled with the FTX implosion earlier this month, caused a 94.5% drop from the historical highs. Investors are waiting with bated breaths for a strong uptrend that could propel SOL to its former glory.
Solana price recovers but lacks momentum
Santiment, a leading on-chain analytics platform, reported a Solana bottom roughly at $11.00. SOL was not left behind, as the crypto market generally rebounded on Wednesday. This could explain the 8.4% upswing over the last 24 hours.
According to Santiment, fear, uncertainty and doubt (FUD) could force Solana to stretch its leg higher. Traders have, in the last few weeks, ganged up against Solana for a southbound move, with some predicting a breakdown to zero.
There are not a lot of big #Solana believers, even as its price bottomed out at $11.02 and rebounded to $12.70 over the past 15 hours. This #FUD could cause more rebounding until traders slow down their nearly unanimous bets against $SOL's price. https://t.co/e2jSAmLEqf pic.twitter.com/1qisr8inaj
— Santiment (@santimentfeed) November 23, 2022
Solana price is back in the green
Solana price trades at $14.36 at the time of writing and after printing two green candles from support at $11.00. Bulls are engaged in a fierce battle with the bears, making the expected break above resistance at $16.00 a daunting task.
From the three-day time frame chart, we can predict the possibility of the Moving Average Convergence Divergence (MACD) indicator sending a buy signal. However, before that, bulls must reinforce their presence in the market by cracking the resistance at $16.00.
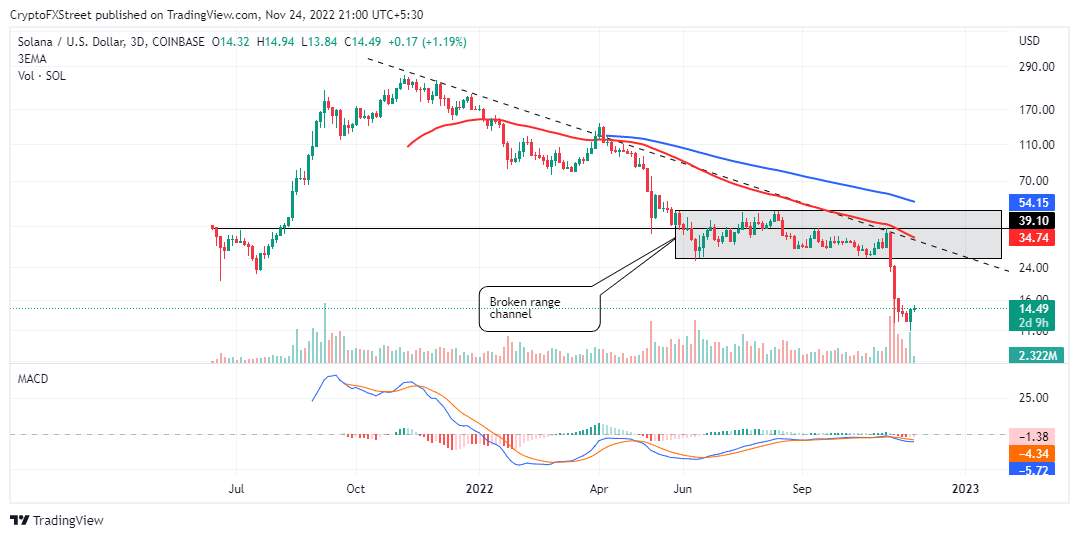
SOL/USD three-day chart
A successful break above $16.00 will not only sabotage the call for a drop to zero but pave the way for a sharp climb to test $26.57 (broken rectangle pattern support) and the 50-day Exponential Moving Average (EMA) (in red) at $34.74.
This is an important price level because it coincides with a falling trend line that has been respected since November 21. Another successful break beyond the trend line could signal an incoming change from a long-term downtrend to a sustainable uptrend.
Solana's rally could be a drop on a hot plate
Author

John Isige
FXStreet
John Isige is a seasoned cryptocurrency journalist and markets analyst committed to delivering high-quality, actionable insights tailored to traders, investors, and crypto enthusiasts. He enjoys deep dives into emerging Web3 tren


