Solana price aims for a 40% rally as bulls break past resistance
- Solana price is currently above a consolidative triangle
- SOL is currently in a no-trade zone
- A break above $106 will lead to significant gains

Solana price may appease side-lined traders to go long as it has broken past key resistance. Still, it is best to consider an alternative scenario as triangles are known to display directional trend fakeouts.
Solana price looks tricky
Solana price has been a more confusing chart, as it has been coiling inside a no-trade zone this month. Both bulls and bears have had their share of dominance on the Layer 1 token. However, this week it appears that the bulls are making a statement now that SOL price has broken out past the consolidative triangle.
Solana price on the 9-hour chart has contradicting signals as both the bears and bulls have been present on the volume profile indicator. It was mentioned in last week’s thesis that a break above Wave C at $106 could be the catalyst to propel SOL price an additional 40% higher based on technical projections. This idea remains as Solana price is currently 15% below the breakout zone.
Traders should consider waiting for $106 to get triggered as consolidation triangles are known to fake out early traders. A break below the trend line is very probable as the Wave E of this potential triangle does not fit the dimensions required amongst Elliot Wave analysts.
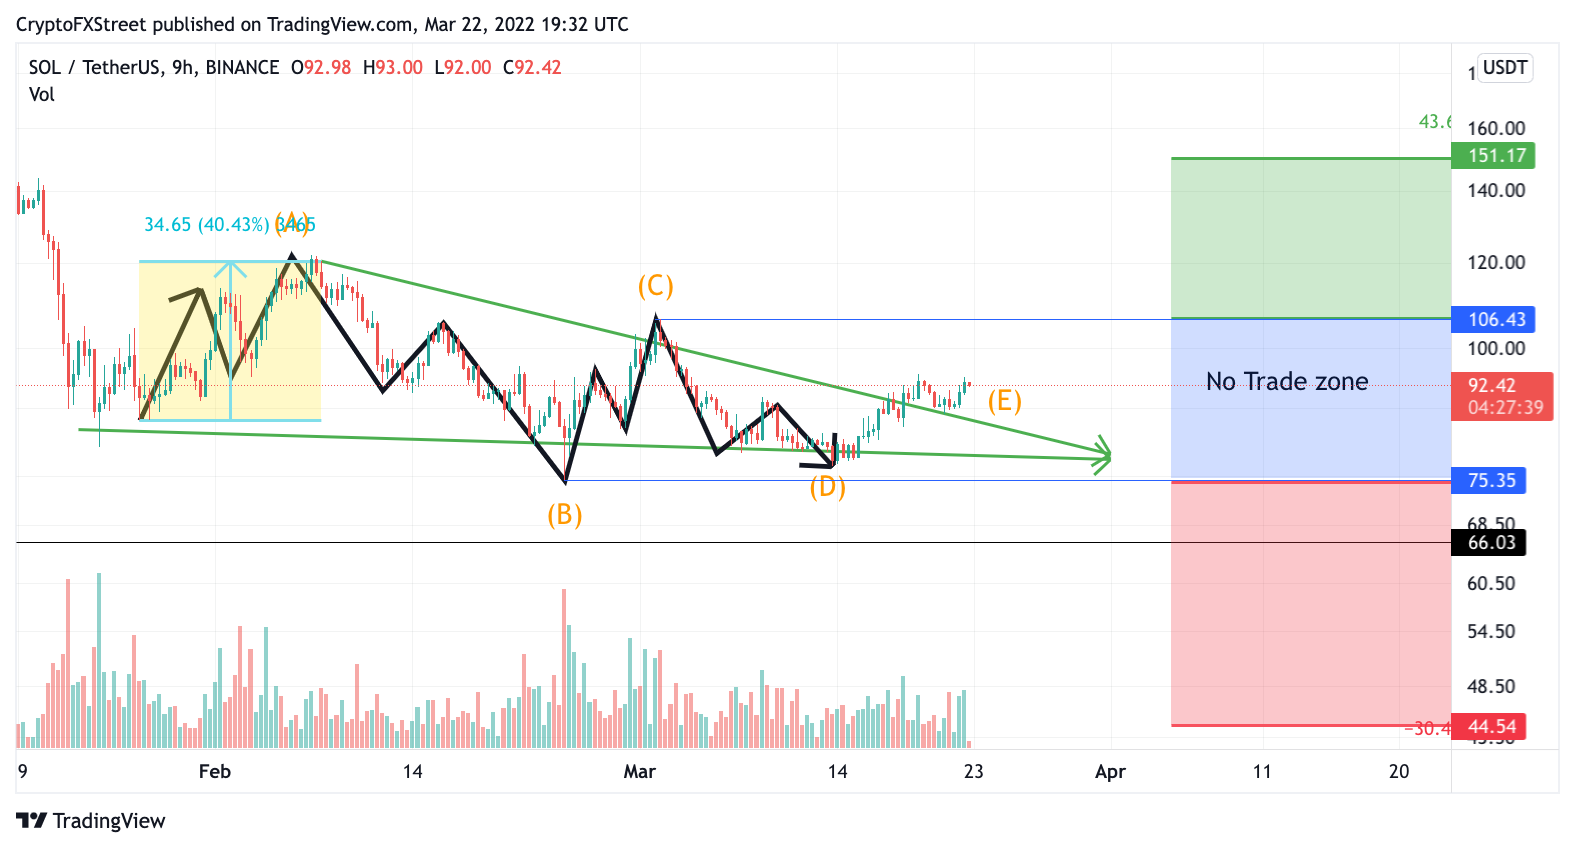
SOL/USDT 9-Hour Chart
If bulls can push Solana price to $106, all signs are a go. SOL should have the strength to reach the $140 zone, representing a 40% increase from the current levels. Traders should consider more promising digital assets within the cryptocurrency market until then.
Author
FXStreet Team
FXStreet
Composed of a group of economic journalists and FX experts, the FXStreet content team produces and oversees all content published on FXStreet. It provides a purely journalistic approach to the Forex market.


