Solana Price is prepping for a 40% rally but should be considered a no-trade zone until the breakout begins
-
Solana Price Is currently forming a triangle consolidation.
-
The relative strength index is creating bullish divergence.
-
Traders should wait for a breakout to begin.

Solana Price is still coiling inside a triangle consolidation. The 2-day chart is adding more confluence that a breakout will soon commence.
Solana price says buy the breakout.
Solana price should have traders on high alert, as the centralized smart contract token is ready to make its next move. The 2-day chart shows four corrective wave patterns (ABCD) that fit the criteria of a prospective coiling triangle. It is worth noting that ‘E’ waves are commonly known to go sideways and form triangles in their own right, so traders should stay away from jumping in too soon.
Solana price is also getting added confluence by The Relative Strength Index, displaying a bullish divergence from the lows printed throughout the last few weeks. However, it should be noted that triangles are commonly known to trap early traders in the wrong direction. Thus, traders should consider Solana as fluctuating within a no trade-zone until confirmation of the next trend arrives.
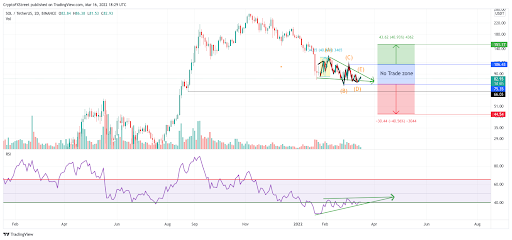
At the current time, a break below the ‘D’ wave at $75.35 could invalidate the no-trade zone idea and will likely be the catalyst to plummet Solana 40% lower into the $45.00 zone. On the contrary, if bulls can carry Solana's price to the higher end of the range, a touch at the current wave ‘C’ of $106.43 could propel Solana's price upwards of 40% into $150.00.
Author
FXStreet Team
FXStreet
Composed of a group of economic journalists and FX experts, the FXStreet content team produces and oversees all content published on FXStreet. It provides a purely journalistic approach to the Forex market.


