Solana entities sold 50M tokens to FTX – How long will SOL price suffer?

Solana (SOL $14) has lost 60% of its market value in a week due to its exposure to the now-defunct crypto exchange FTX, which could continue to haunt the "Ethereum killer" well into the future.
FTX/Alameda exposure hurting Solana price
FTX and its sister-firm Alameda Research is liable to have control over 50 million SOL, according to Solana's statement released on Nov. 10.
The FTX entities received 4 million SOL from the Solana Foundation on Aug. 31, 2020. They also started receiving a portion of 12 million SOL from Sep. 11, 2020, and nearly 34.52 million SOL from Jan. 7, 2021, through a "linear monthly unlock" mechanism.
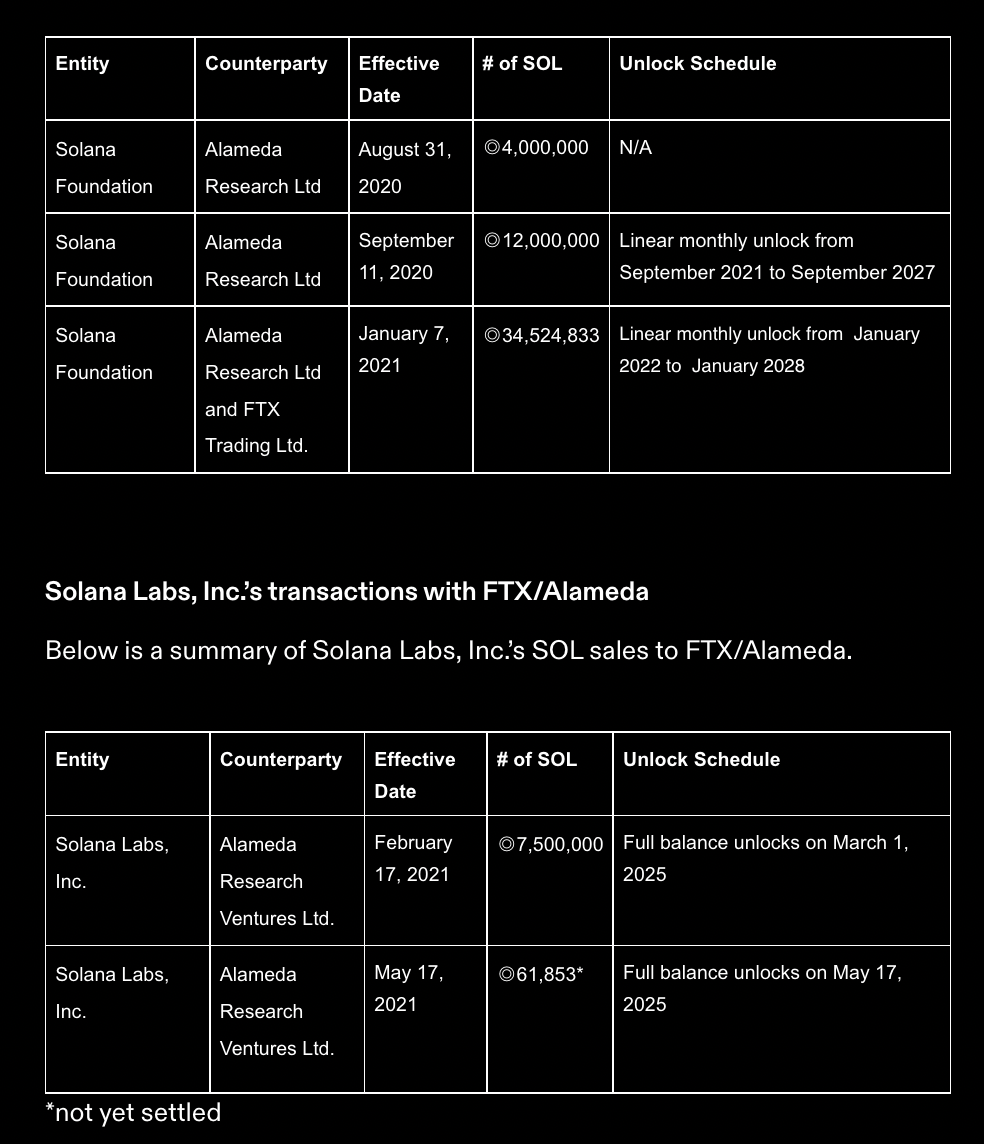
Summary of SOL sales to FTX/Alameda Research. Source: Solana Labs
Furthermore, the FTX entities started receiving portions of a 7.5 million SOL reserve from Solana Labs on Feb. 17, 2021. Notably, a transaction worth 62,000 SOL between the same entities stands unsettled.
Most SOL tokens promised to FTX/Alameda are vested, meaning the firm does not yet have them in custody but is liable to receive them through the linear monthly unlock mechanism. The last of these unlocks will occur by January 2028.
That leaves the market with interpretations about what might happen to the SOL tokens once they are unlocked, given FTX's bankruptcy filing that's likely to put a freeze on all remaining funds.
Also, the firm reportedly has $9 billion in liabilities versus a $1 billion balance sheet, which could prompt its trustees to liquidate its SOL holdings to repay debtors.
To avoid such a scenario, Solana could make technical changes to its token economy, reducing FTX's impact. One recent governance proposal submitted on Nov. 13 presented a few options that could be on the table, including:
-
The errant allocation is burned.
-
Increase the lock to 10 years on the errant allocation.
-
Airdrop all SOL token holders' additional SOL, except for the party holding the errant allocation.
-
A combination of the above.
SOL price relief bounce?
From a technical perspective, Solana shows signs of bullish divergence between its price and relative strength index (RSI).
A bullish divergence materializes when an asset's price forms lower lows but its momentum indicator form a higher low. Traditional analysts see it as a buy signal, which may result in a short-term SOL price recovery on its daily chart.
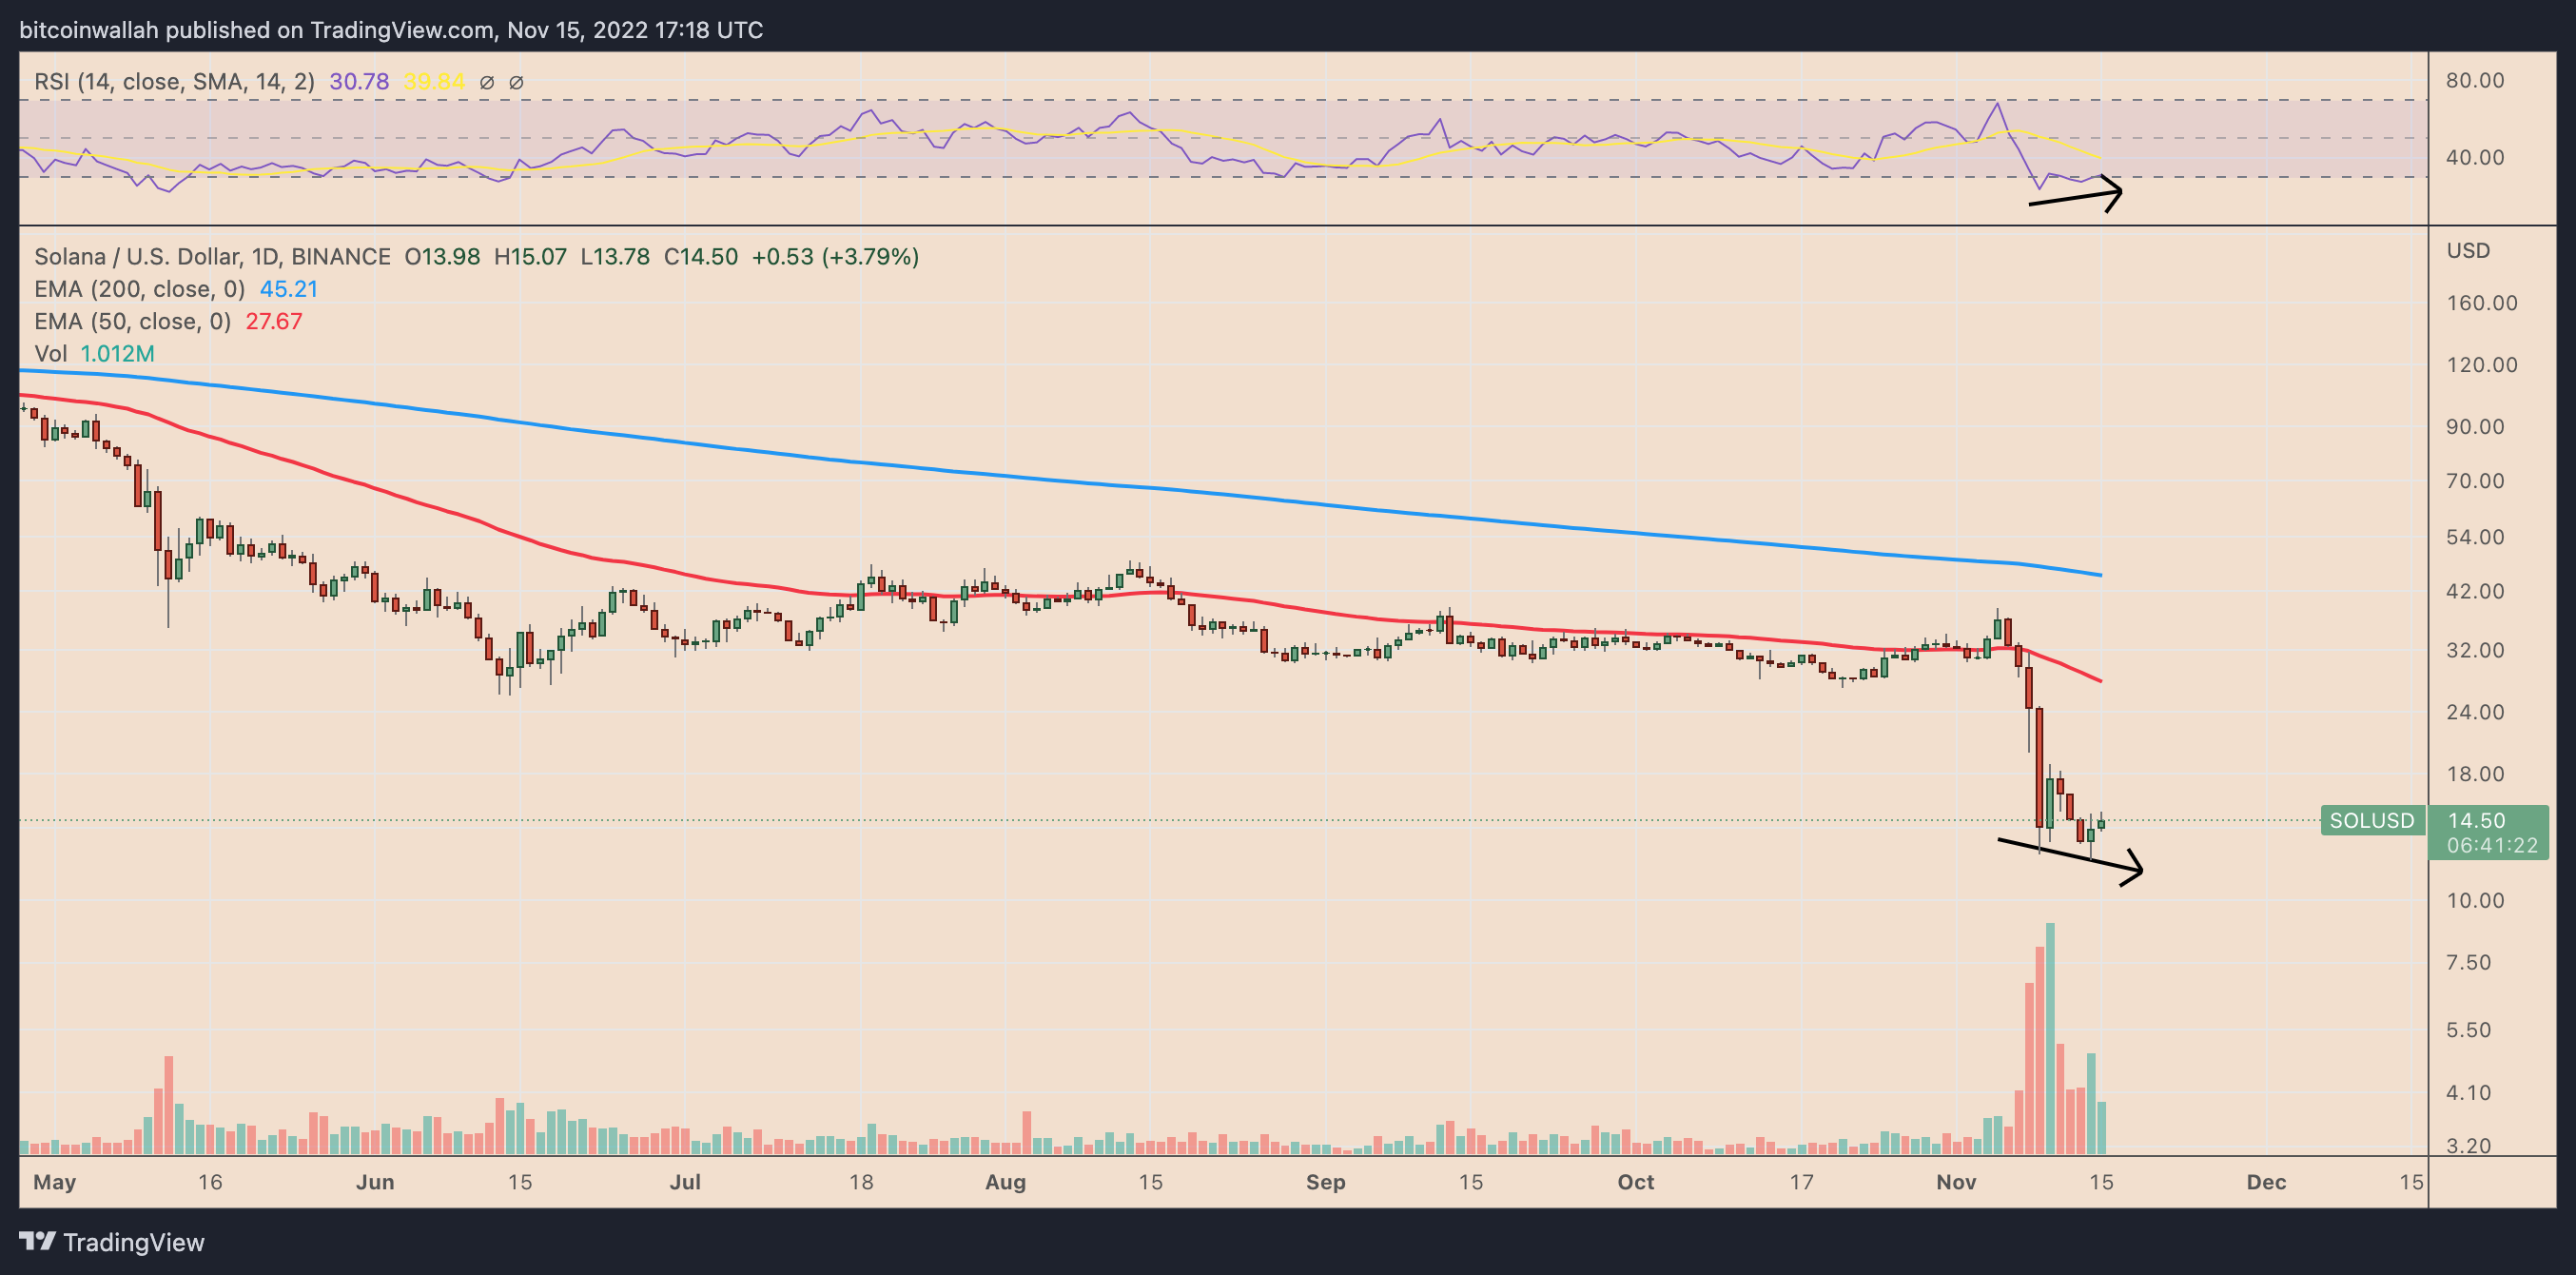
SOL/USD daily price chart featuring bullish divergence. Source: TradingView
SOL/USD could rise toward $18, its range resistance level, in the event of a short-term recovery. In other words, a 20% rebound.
But on longer-timeframe charts, SOL could see further decline toward $2.50, or an 80%-plus drop, in 2023, based on a giant head-and-shoulders setup shown below.
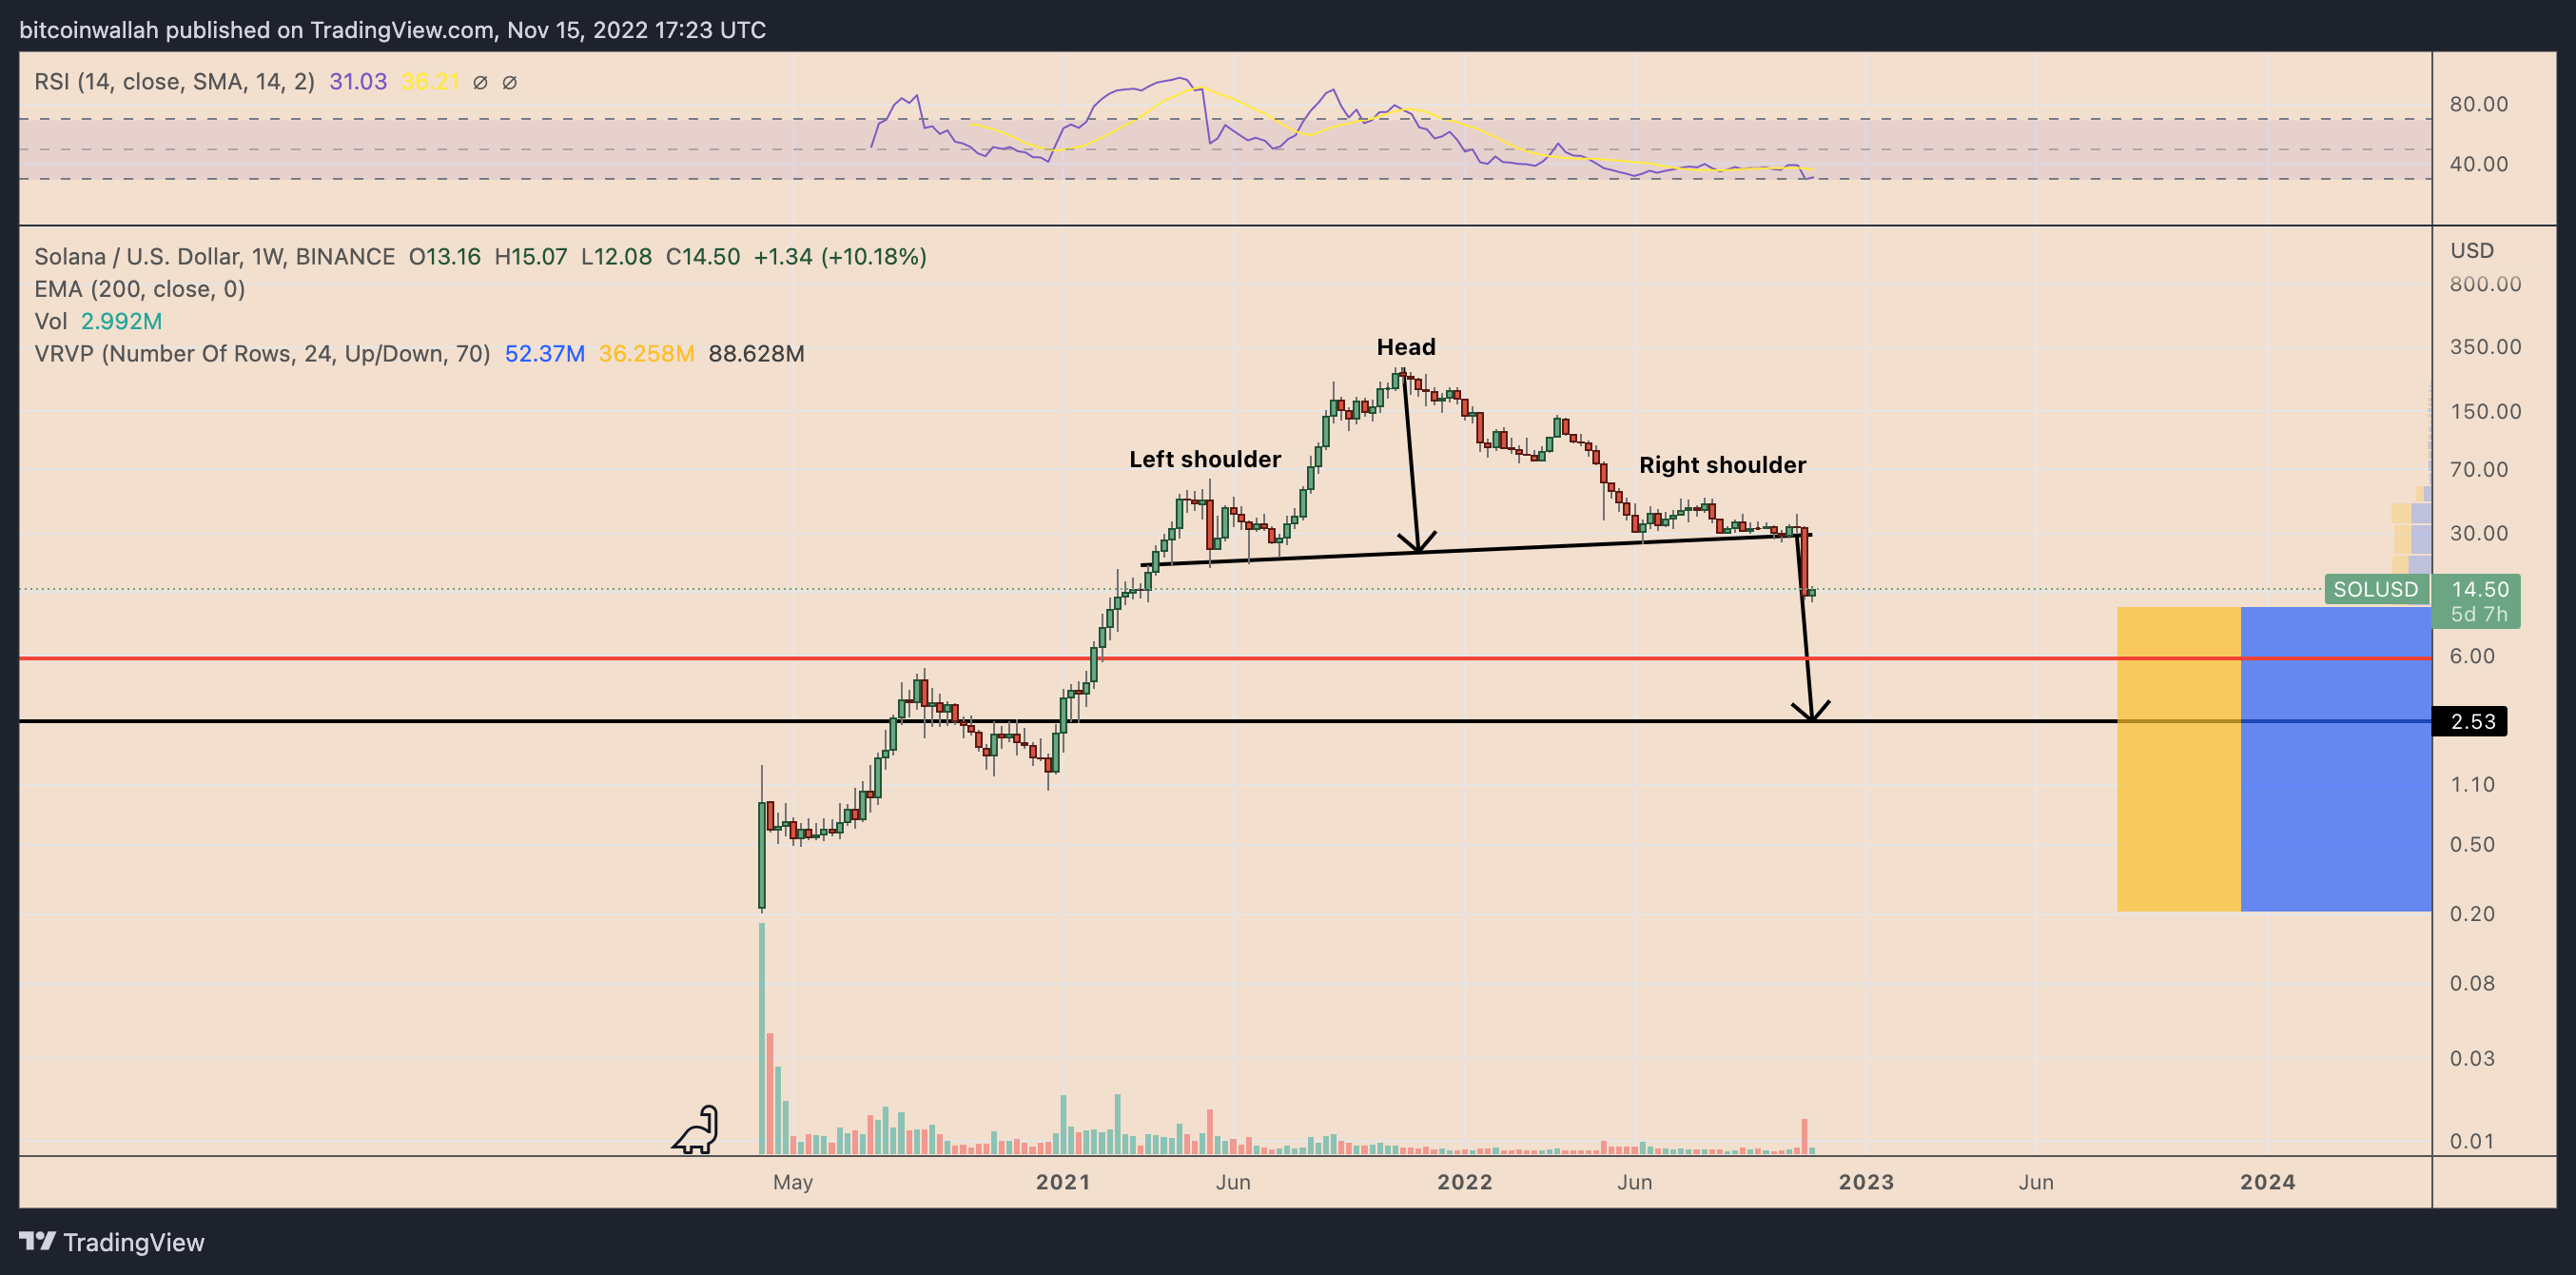
SOL/USD weekly price chart featuring head-and-shoulder breakdown setup. Source: TradingView
Interestingly, the token's downside target falls in its most voluminous range, per its Volume Profile Visible Range, or VPVR, indicator.
Author

Cointelegraph Team
Cointelegraph
We are privileged enough to work with the best and brightest in Bitcoin.




