Solana blockchain spurs carbon footprint transparency with emissions dashboard launch
- Solana Foundation has introduced a real-time carbon emissions tracker for monitoring the Solana blockchain.
- The innovation is a product of collaboration between Solana and the data platform Trycarbonara.
- It is the first major smart-contract blockchain to measure real-time carbon emissions.

Solana Foundation has introduced real-time carbon emissions monitor to keep track of the Solana blockchain. The innovation is a product of collaboration between Solana and data platform Trycarbonara, bringing forth a live tracking dashboard capable of measuring carbon emissions on the Solana blockchain.
1/ Today, the Solana Foundation is leading the charge in the climate fight by making Solana one of the first blockchains to have its emissions measured in real time, thanks to a new data portal created with TryCarbonara.
— Solana (@solana) April 21, 2023
Learn more: https://t.co/k4QsZmtjHn pic.twitter.com/gqPwpKtv3u
Also Read: Dogecoin carbon emissions down by 25% following Elon Musk collaboration
Solana to inspire a trend toward carbon emission transparency in the blockchain space
The Solana Foundation has released an official blog post to describe the development, noting that it represents the first "major smart-contract blockchain" for measuring carbon emissions in real-time. With this product, the organization intends to foster a trend toward carbon emissions transparency in the blockchain space. Citing the organization:
The Solana Foundation hopes to set a new standard for measuring emissions in blockchain by publishing this data.
Describing the new dashboard, the Foundation details that it is accessible on the Solana Climate website, with the available trackers currently displaying "the total node count, megawatt-hours, total carbon emissions average, and marginal use" and several other indicators. Further, it features multiple emission comparison charts to help users see the conversions side-by-side, which depict usage against several other activities that produce emissions.
3/ The tracker also includes comparison charts that help put the carbon footprint of the @Solana blockchain and individual interactions with the chain in perspective. pic.twitter.com/sUJlM07YI2
— Solana (@solana) April 21, 2023
Noteworthy, the emissions tracker changes dynamically based on throughput and changes in the validator network. These include "emissions of RPC nodes, the carbon footprint of individual validators, and embodied emissions featuring hardware manufacturing and transport. "
Solana footprint comparative scale
Based on the chart, when a gallon of gasoline burns, it produces the equivalent of performing 140,416.67 transactions on the Solana blockchain. On the other hand, the simple act of searching on Google adds up to 1.25 transactions.
The amount of data required to power the real-time carbon emissions dashboard of the Solana Foundation is available open-source, structured around the estimated carbon footprint of the Dell PowerEdge R940.
While there is no certainty on whether other blockchain outfits will embrace Solana's tracking systems, the Foundation's move is indeed timely, coming during a time when there is a growth in global efforts to leverage blockchain technology in monitoring carbon emissions worldwide.
Using blockchain to reduce carbon footprint
The European Commission is a politically autonomous but executive arm of the European Union (EU) and works alongside the European Council. In its initiative dubbed "Shaping Europe's digital future," the commission has hailed blockchain's ability to serve as a foundation for precisely measuring carbon emissions in all sectors.
Citing an article on the EU's digital strategy blog, the commission highlights:
Blockchain can be utilized through smart contracts to calculate better, track and report on the reduction of the carbon footprint across the entire value chain.
Meanwhile, United States President Joe Biden revealed budget plans only recently, indicating that it would add an excise on electricity used for crypto mining by 30%.
Solana price could bounce 30% after hitting this level
Solana price (SOL) has been trading with a bearish bias since a bearish insurgence on April 17. SOL is down around 20% in less than a week, and investors should expect further declines before a possible pullback.
At the time of writing, SOL is auctioning at $21.15, down 5% over the last 24 hours. If bearish momentum increases, Solana price could tag $19.79 soon. A break below this level could trigger massive sell-offs that could lower the altcoin's market value.
Nevertheless, judging from the previous price actions, this critical support level could provide the turning point for Solana price to correct, as it represents a significant supplier congestion zone.
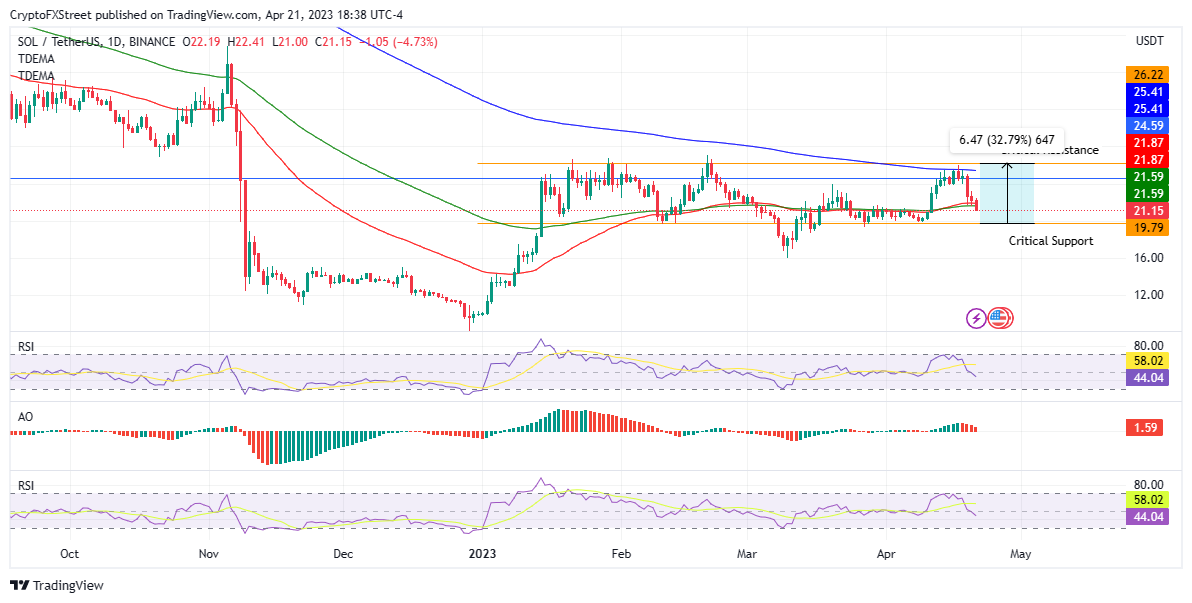
SOL/USDT 1-day chart
If sidelined investors buy SOL at the $19.79 support level, Solana price could embrace a northbound move, breaching the hurdles due to the 100-and 50-day Exponential Moving Averages (EMA) at $21.60 and $21.87, respectively.
Further north, Solana price could ascend past the $24.59 roadblock before tagging the 200-day EMA at $25.41. In the highly bullish case, the Ethereum killer could extend a neck up, tagging the $26.22 resistance level, denoting a 30% increase from the current price.
Author

Lockridge Okoth
FXStreet
Lockridge is a believer in the transformative power of crypto and the blockchain industry.


