Solana bears dominate market as SunPump has potentially led to less demand for SOL
- Solana funding rates turned negative as shorts dominated the market.
- The launch of Pump.fun competition, SunPump, has potentially led to less demand for SOL.
- Solana could bounce around the $136 support if long traders return to the market.

Solana (SOL) is down 2.5% on Thursday following bearish signals across its funding rate and total fees captured. SOL's weak performance could also be linked to the declining traction seen in its meme coin generation platform Pump.fun since its competition, SunPump, launched on the Tron blockchain.
Solana on-chain metrics indicate a bearish outlook
Futures trades are bearish on SOL as its funding rate turned negative on Thursday, per Coinglass data. Funding rates are periodic payments set by exchanges to maintain a balance between a futures contract's price and the underlying asset it tracks. When funding rates are negative, it signals increased bearish pressure from shorts and vice versa when positive.
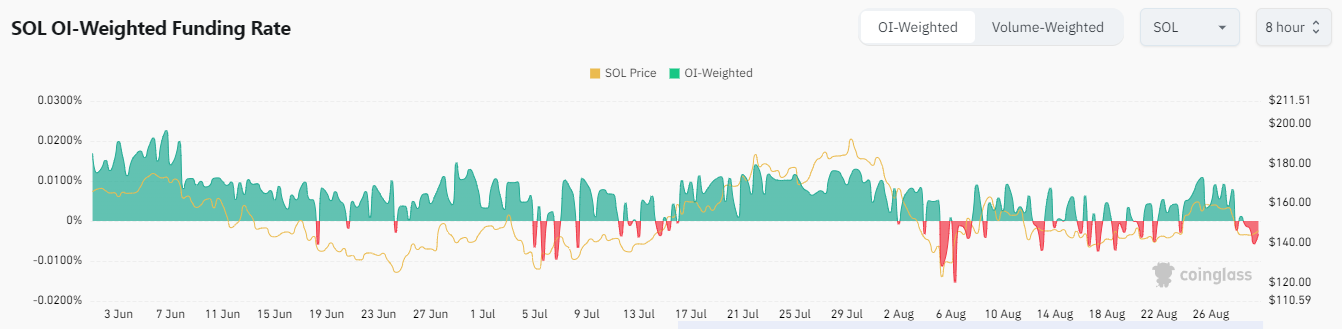
SOL Funding Rates
If SOL's funding rates remain negative for an extended period, long traders could likely intervene to cause massive short liquidations.
In the past 24 hours, SOL has seen $5.77 million in liquidations, with long liquidations accounting for nearly 90%.
SOL's Weighted Sentiment is also at -0.4, indicating minimal or negative sentiment towards Solana.
A possible reason for the bearish outlook toward Solana may be lesser demand for SOL due to the declining traction of its meme coin generation platform Pump.fun since the launch of its competition, SunPump, on the Tron blockchain on August 9. The chart below shows that the transaction fees captured on Solana have been trending downward since August 9, per DefiLlama data.
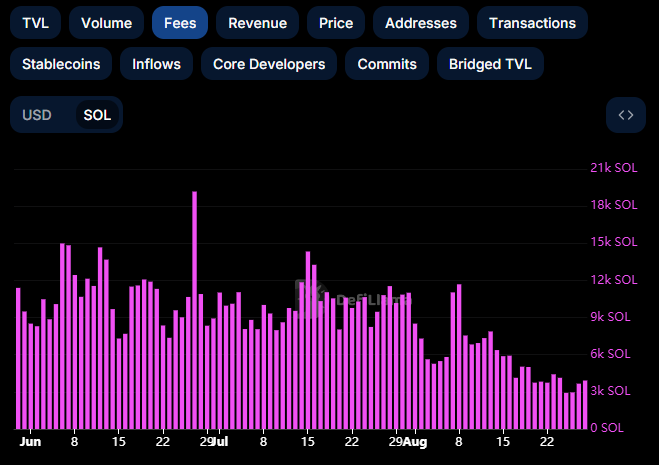
SOL Transaction Fees
In comparison, Tron's transaction fee has been rising since August 18, and its price has risen more than 20% in the two-week timeframe. On the other hand, SOL has declined by 1% within the same period.
Solana could bounce around key support level
Solana is trading within key rectangular channels on the daily chart. It is experiencing a heavy correction after seeing a rejection around the resistance at $163.69.
SOL has crossed below the 50-day, 100-day and 200-day Simple Moving Averages (SMA), indicating a bearish signal. With the move, SOL is approaching a key support level around $136. A bounce off this level could send it upwards to test the $163.69 resistance again. If SOL crosses above this level, it could aim for the $193.93 resistance.
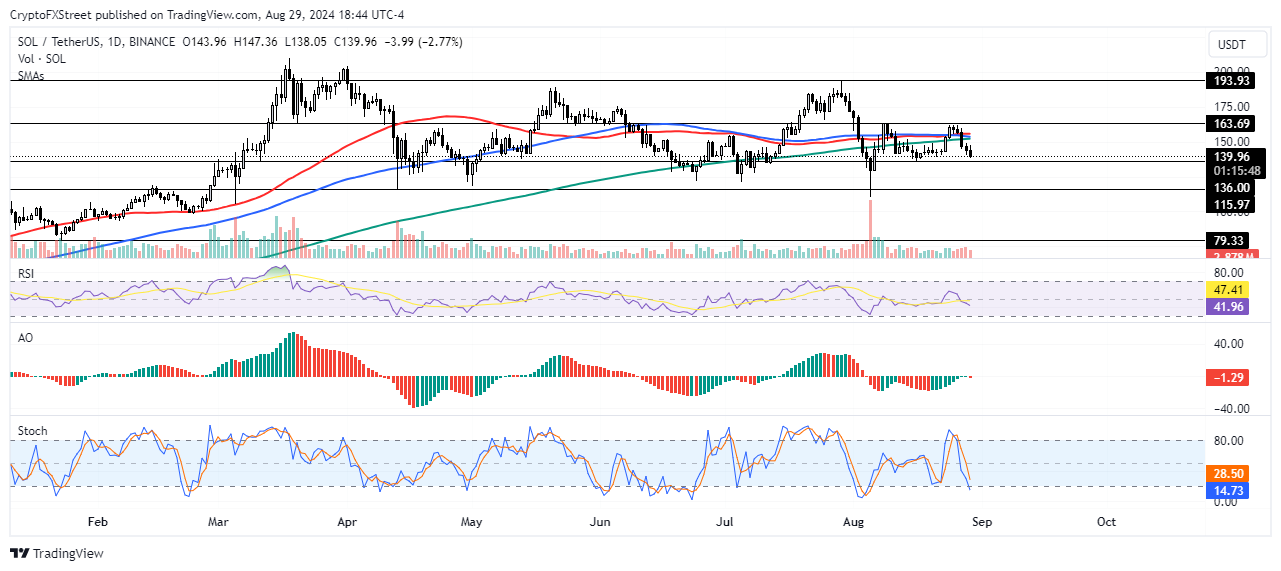
SOL/USDT Daily chart
A daily candlestick close below the $136 support level will invalidate this thesis. Such a move could send SOL toward the support at $115.97.
The Relative Strength Index (RSI) indicates increased bearish momentum after breaching its moving average around the midline.
The Awesome Oscillator (AO) is indicating the prevalence of bearish momentum after posting a red bar below the zero line.
The %K line of the Stochastic Oscillator (Stoch) crossed below its %D line on Monday and has entered the oversold region. While this also indicates increased bearish momentum, traders often open buy orders when the Stoch enters the oversold region.
In the short term, SOL could rise to $147.58 to liquidate positions worth $31.29 million.
Cryptocurrency prices FAQs
Token launches like Arbitrum’s ARB airdrop and Optimism OP influence demand and adoption among market participants. Listings on crypto exchanges deepen the liquidity for an asset and add new participants to an asset’s network. This is typically bullish for a digital asset.
A hack is an event in which an attacker captures a large volume of the asset from a DeFi bridge or hot wallet of an exchange or any other crypto platform via exploits, bugs or other methods. The exploiter then transfers these tokens out of the exchange platforms to ultimately sell or swap the assets for other cryptocurrencies or stablecoins. Such events often involve an en masse panic triggering a sell-off in the affected assets.
Macroeconomic events like the US Federal Reserve’s decision on interest rates influence risk assets like Bitcoin, mainly through the direct impact they have on the US Dollar. An increase in interest rate typically negatively influences Bitcoin and altcoin prices, and vice versa. If the US Dollar index declines, risk assets and associated leverage for trading gets cheaper, in turn driving crypto prices higher.
Halvings are typically considered bullish events as they slash the block reward in half for miners, constricting the supply of the asset. At consistent demand if the supply reduces, the asset’s price climbs. This has been observed in Bitcoin and Litecoin.
Author

Michael Ebiekutan
FXStreet
With a deep passion for web3 technology, he's collaborated with industry-leading brands like Mara, ITAK, and FXStreet in delivering groundbreaking reports on web3's transformative potential across diverse sectors. In addition to


