Shiba Inu sees bulls ready to break the bearish triangle
- Shiba Inu price action has been stuck in a bearish triangle since December 1st.
- SHIB price sees bulls getting in for the squeeze and a return towards $0.00004490.
- Expect to see more bullish price action going into the weekend towards $0.00005690.
Shiba Inu (SHIB) price is being squeezed higher as it pushes up against the red descending trend line of a bearish triangle which has kept SHIB price action in a chokehold since December 1st. As bulls knock against the descending red trend line, expect an acceleration in price action if the succeed in breaking through it. A successful penetration above, would provide the impetus for a push higher towards $0.0000490, in the first leg, and then $0.00005690 by the weekend.
With a breakout, 76% of gains could be on the table
Shiba Inu price is ready to break above the red descending trend line that has been capping SHIB price action from further gains. As bulls stand firm at $0.000003200, expect – with the help of supportive sentiment – for the red descending trend line to be broken, and for an explosion of buying volume to follow, from sidelined investors jumping on the bullish signal. In the first phase, price action could quickly go to $0.00004490, the 61.8% Fibonacci level.
SHIB price will then face some profit-taking and hesitation from investors who joined the rally too late. The 55-day Simple Moving Average (SMA) at $0.000004765 will offer resistance, with SHIB price dipping back towards $0.00004490 for support. With a bounce off there, last-minute investors will join, which should be sufficient to push SHIB price action towards the 50% Fibonacci level at $0.00005690.
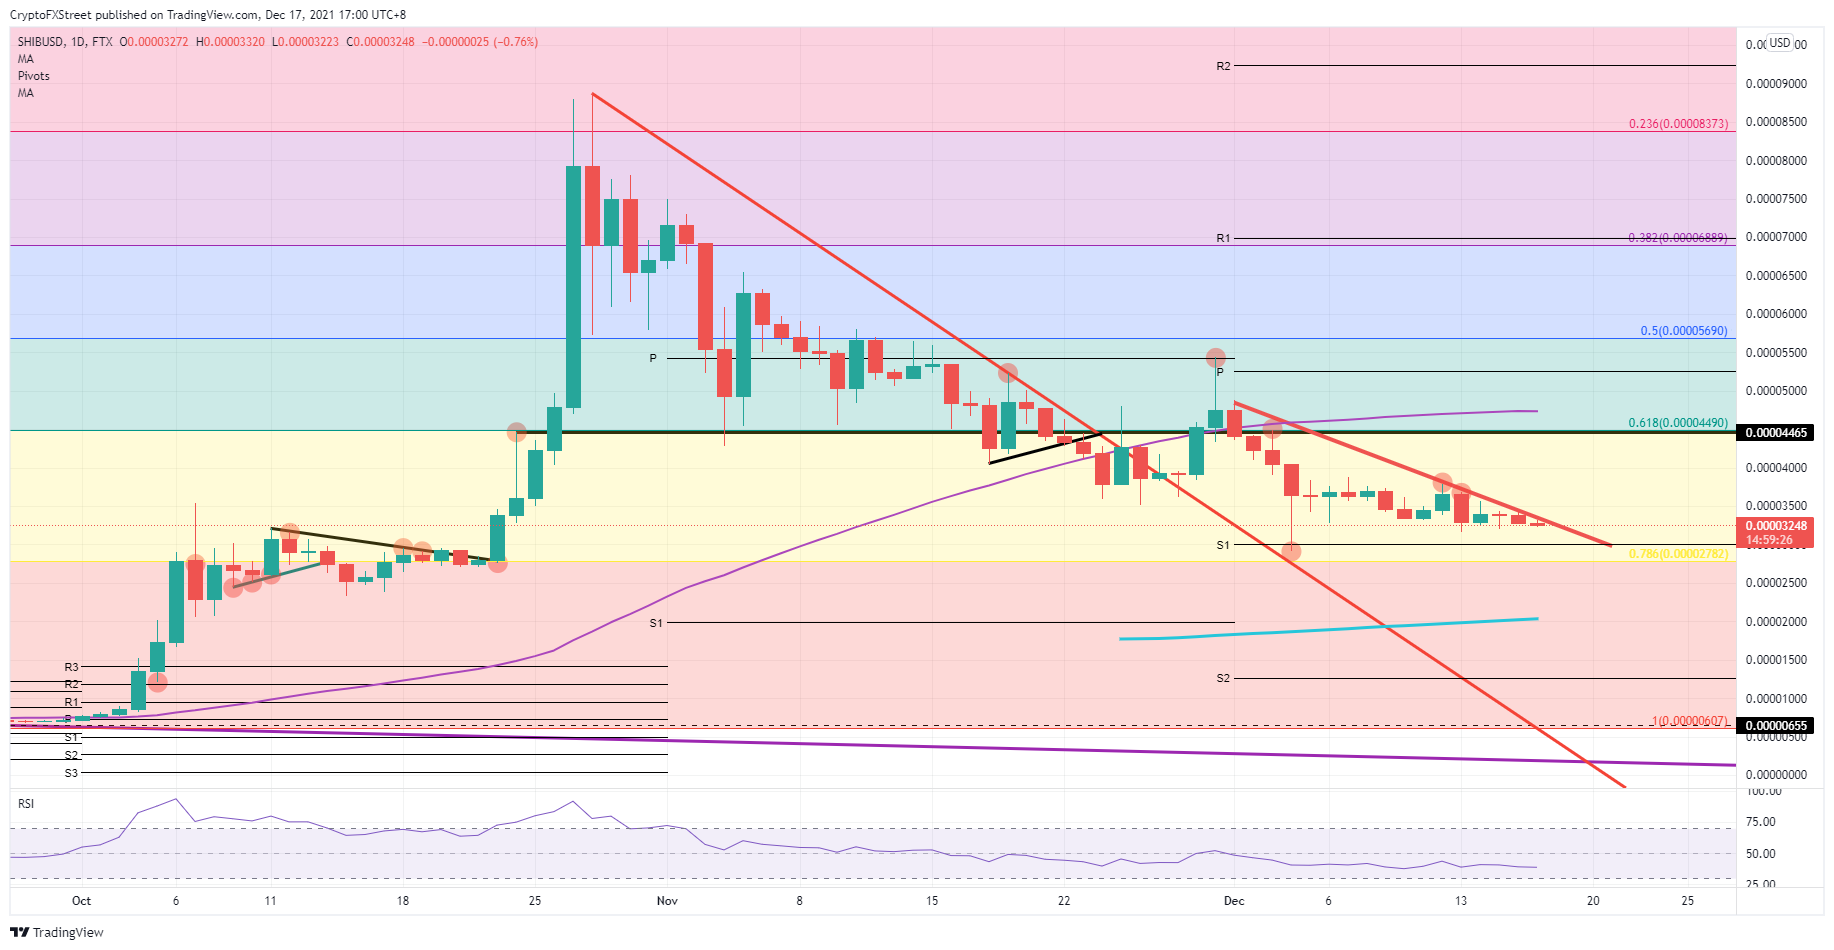
SHIB/USD daily chart
Headwinds in global markets, after central bank divergence at Wednesday and Thursdays’ meetings, could cause a false breakout above the red descending trend line, or a rally towards $0.00004490, but accompanied by a strong fade that pares back profits. A break to the downside would take out the 78.6% Fibonacci level at $0.00002782, ready for a dip towards $0.00002000 with the 200-day SMA coming in strongly with support.
Author

Filip Lagaart
FXStreet
Filip Lagaart is a former sales/trader with over 15 years of financial markets expertise under its belt.


