Shiba Inu presents 3 to 1 buy opportunity before SHIBA breaks out
- Shiba Inu price develops a significant bullish reversal pattern.
- Participants have been consolidating in a tight range, fueling any breakout.
- The anticipated target is near the all-time high.
Shiba Inu price has been consolidating for the past ten days, establishing a support zone near the 88.6% Fibonacci retracement at $0.00003200. SHIBA is likely coiling for a giant price spike – the direction of the spike being higher if the broader market can catch a bid.
Shiba Inu price is positioning for a breakout that could see a 90% gain
Shiba Inu price has been stagnant for a while, frustrating many hodlers in the process. The Relative Strength Index on the daily chart has barely deviated from the final oversold level in a bull market (40). Likewise, the Composite Index has sat in a neutral condition ever since December 5. This consolidation could be the beginning of a significant price spike.
One of the most sought-after reversal patterns in Point and Figure Analysis is the Shakeout Pattern. Unfortunately, this pattern doesn’t show up often, and it is only valid if an instrument is already in a broader uptrend. The Bullish Fakeout Pattern forms after a long column of Os drops below a multiple bottom by at least two, but no more than three, Os.
The hypothetical long setup for Shiba Inu price is a buy stop at the 3-box reversal ($0.00004000), the stop loss is a 5-box stop, and a profit target at $0.00007750. The profit target is derived from the Vertical Profit Target Method in Point and Figure Analysis. A trailing stop of two to three boxes would help protect any implied profits post entry.
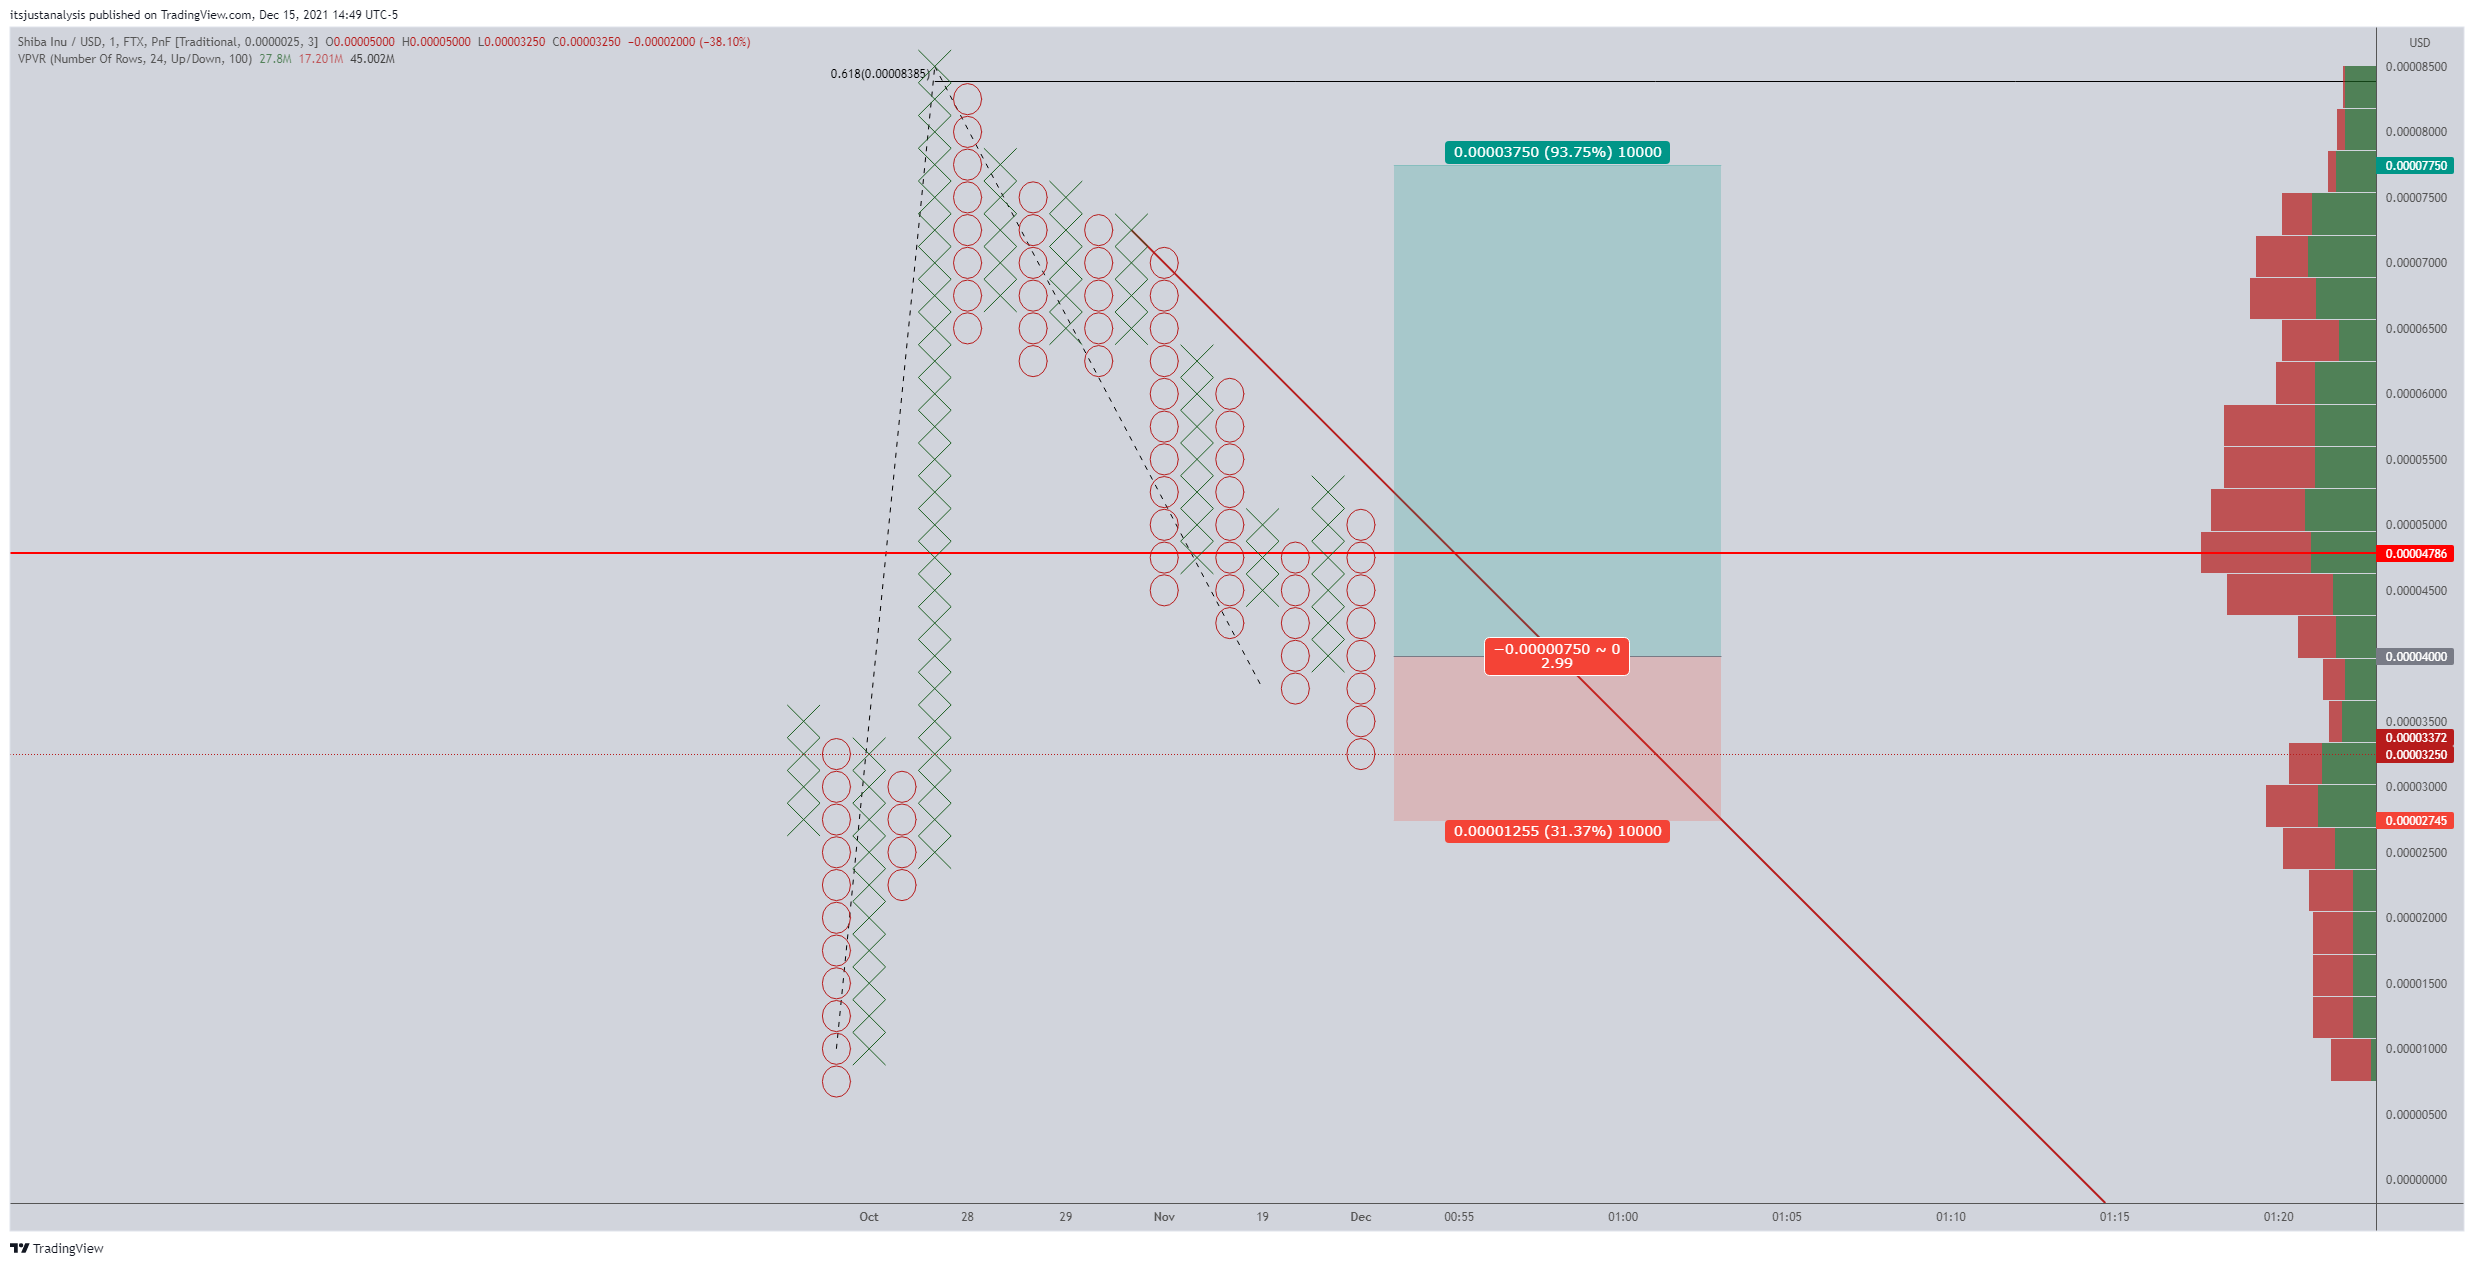
SHIBA/USDT $0.00005/3-box Reversal Point and Figure Chart
Shiba Inu price can only move one more O below to $0.00003000. If it prints another O below that, the trade is invalidated, and SHIBA would likely retest the $0.00002000 level.
Author

Jonathan Morgan
Independent Analyst
Jonathan has been working as an Independent future, forex, and cryptocurrency trader and analyst for 8 years. He also has been writing for the past 5 years.


