Shiba Inu price to dip 26%, allowing investors to buy SHIB at discount
- Shiba Inu price looks to be forming a rising wedge pattern, hinting at an incoming correction.
- A breakdown of the lower trend line at $0.00002828 will likely lead to a 13% correction to $0.00002540.
- In some cases, SHIB might head to $0.00002186, creating a bottom reversal pattern.

Shiba Inu price has been consolidating since its local top on October 7. This coiling up price action has pushed SHIB to produce a rising wedge formation, suggesting a correction.
Shiba Inu price looks ripe for harvesting
Shiba Inu price has been on fire, especially after an eye-popping 392% upswing between October 1 and October 7. Since hitting a local top at $0.00003528, SHIB has entered a consolidation that set up a swing low at $0.2186 on October 8.
Including this point, SHIB has created three higher lows and two higher highs. Connecting these swing points using trend lines reveals the formation of a rising wedge.
This technical formation forecasts a 26% downswing determined by adding the distance between the first swing high and swing low to the breakout point.
While this might seem like a steep correction, the $0.00002540 support floor will be a significant barrier. There are chances for SHIB to bounce off this level and mitigate the losses, but if the selling pressure continues to increase, a revisit of $0.00002186 is likely.
Either way, this drop will allow Shiba Inu holders to accumulate or buy the dip as a retest of $0.00002186 will form a double-bottom pattern, indicating a reversal of the downtrend and a continuation of its uptrend.
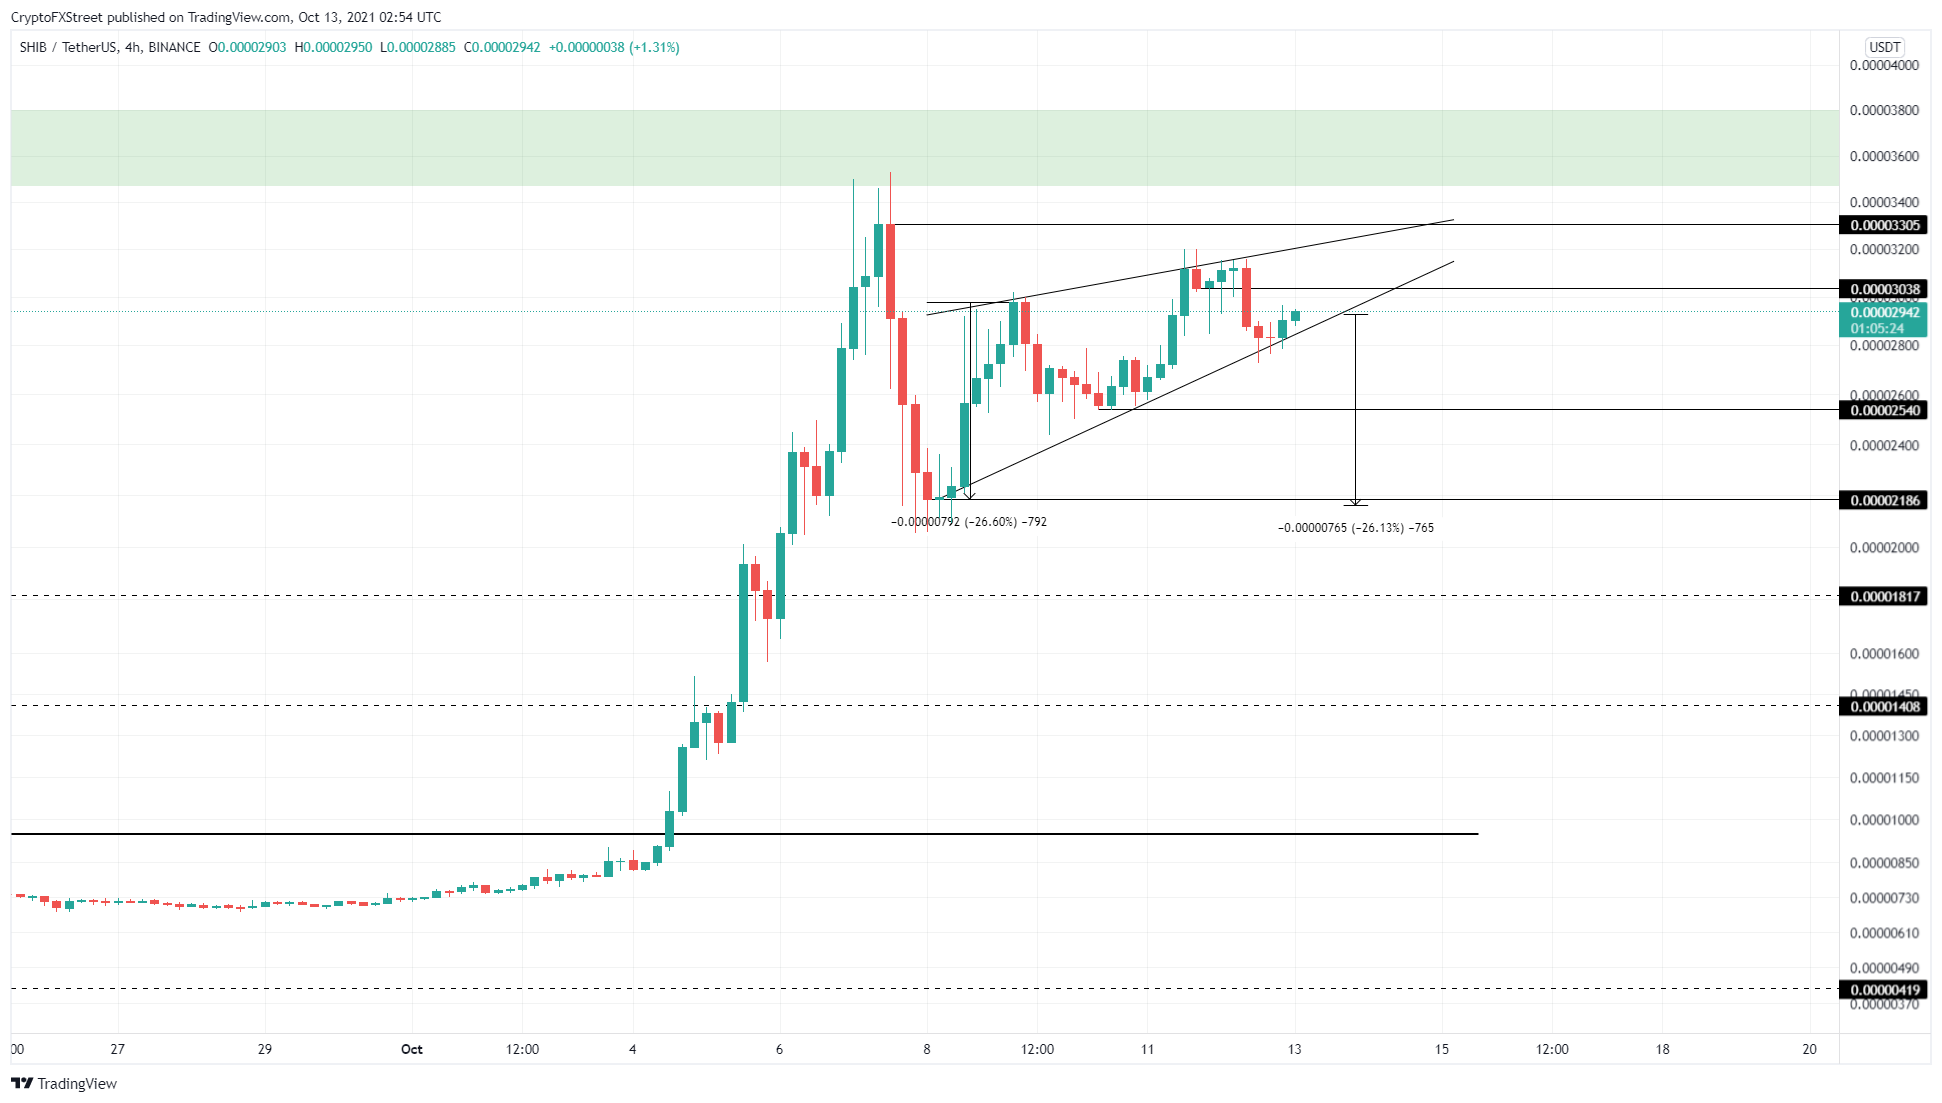
SHIB/USDT 4-hour chart
While things are looking bearish for Shiba Inu price, a decisive close above $0.00003038 will be the bears’ first sign of weakness. If SHIB buyers push it to produce a higher high above $0.00003305, it wil invalidate the bearish thesis.
In such a case, investors can expect Shiba Inu price to climb to the $0.00003468 to $0.00003799 supply zone.
Author

Akash Girimath
FXStreet
Akash Girimath is a Mechanical Engineer interested in the chaos of the financial markets. Trying to make sense of this convoluted yet fascinating space, he switched his engineering job to become a crypto reporter and analyst.