Shiba Inu price ready to spring to $0.000050
- Shiba Inu price testing resistance turned support.
- SHIBA presents a buying opportunity before a massive rally begins.
- Downside risks remain a concern and may be substantial.
Shiba Inu price has been in a downtrend now for 135 days. From a time cycle perspective, a combination of Gann and Ichimoku cycles may point to when SHIBA makes a bullish turn.
Shiba Inu price holds support at $0.000022, buyers still avoidant
Shiba Inu price action is right up against the top of a prior trading range found at $0.000022 that developed in late January 2022 to early February 2022. The range has been tested considerably throughout late February, especially with the last five trading days.
At the time of publication, Shiba Inu price has its daily close below the upper range of that support zone, signaling a probable successful break of the support level. However, SHIBA could travel lower towards the low part of the trading range at $0.000020. And from a time cycle perspective, a continuation of the slow and persistent drop may continue for another 10 to 12 days.
There are three important time cycles up ahead, which indicate a massive rally between now and March 21, 2022.
The first time cycle is the Kumo Twist between March 11 and March 12. Kumo Twists are periods where Senkou Span A crosses Senkou Span B (the Cloud changes from red to green or green to red). When an instrument is trending in a single direction, Kumo Twists can often give a heads up that a swing high or low is likely to be established around that period.
The second time cycle was discussed on the FXStreet YouTube channel on Tuesday, one of Gann’s Seasonal Dates: March 21. Historically, March 21 is a precursor to massive moves in the cryptocurrency market. If the market has been in a downtrend, then the March 21 date warns that an uptrend is likely to begin – and vice versa.
The third cycle is one of Gann’s Cycles of the Inner Year, specifically the 135-day cycle. This cycle, in particular, may be the most important of the three because of how much Shiba Inu price has followed the expected conditions of price in this cycle. Gann indicated the following traits associated with the 135-day cycle:
- It is often the last low, more typically a higher low which ends a bottoming pattern.
- If a low was found at 90-days (Shiba Inu did form a bottom within the 90-day cycle from its all-time high), then 135-days is also 45-days from that low (which is exactly where SHIBA is at).
- Fast moves can start.
- Always watch for a change in trend.
- It can go to a lower low.
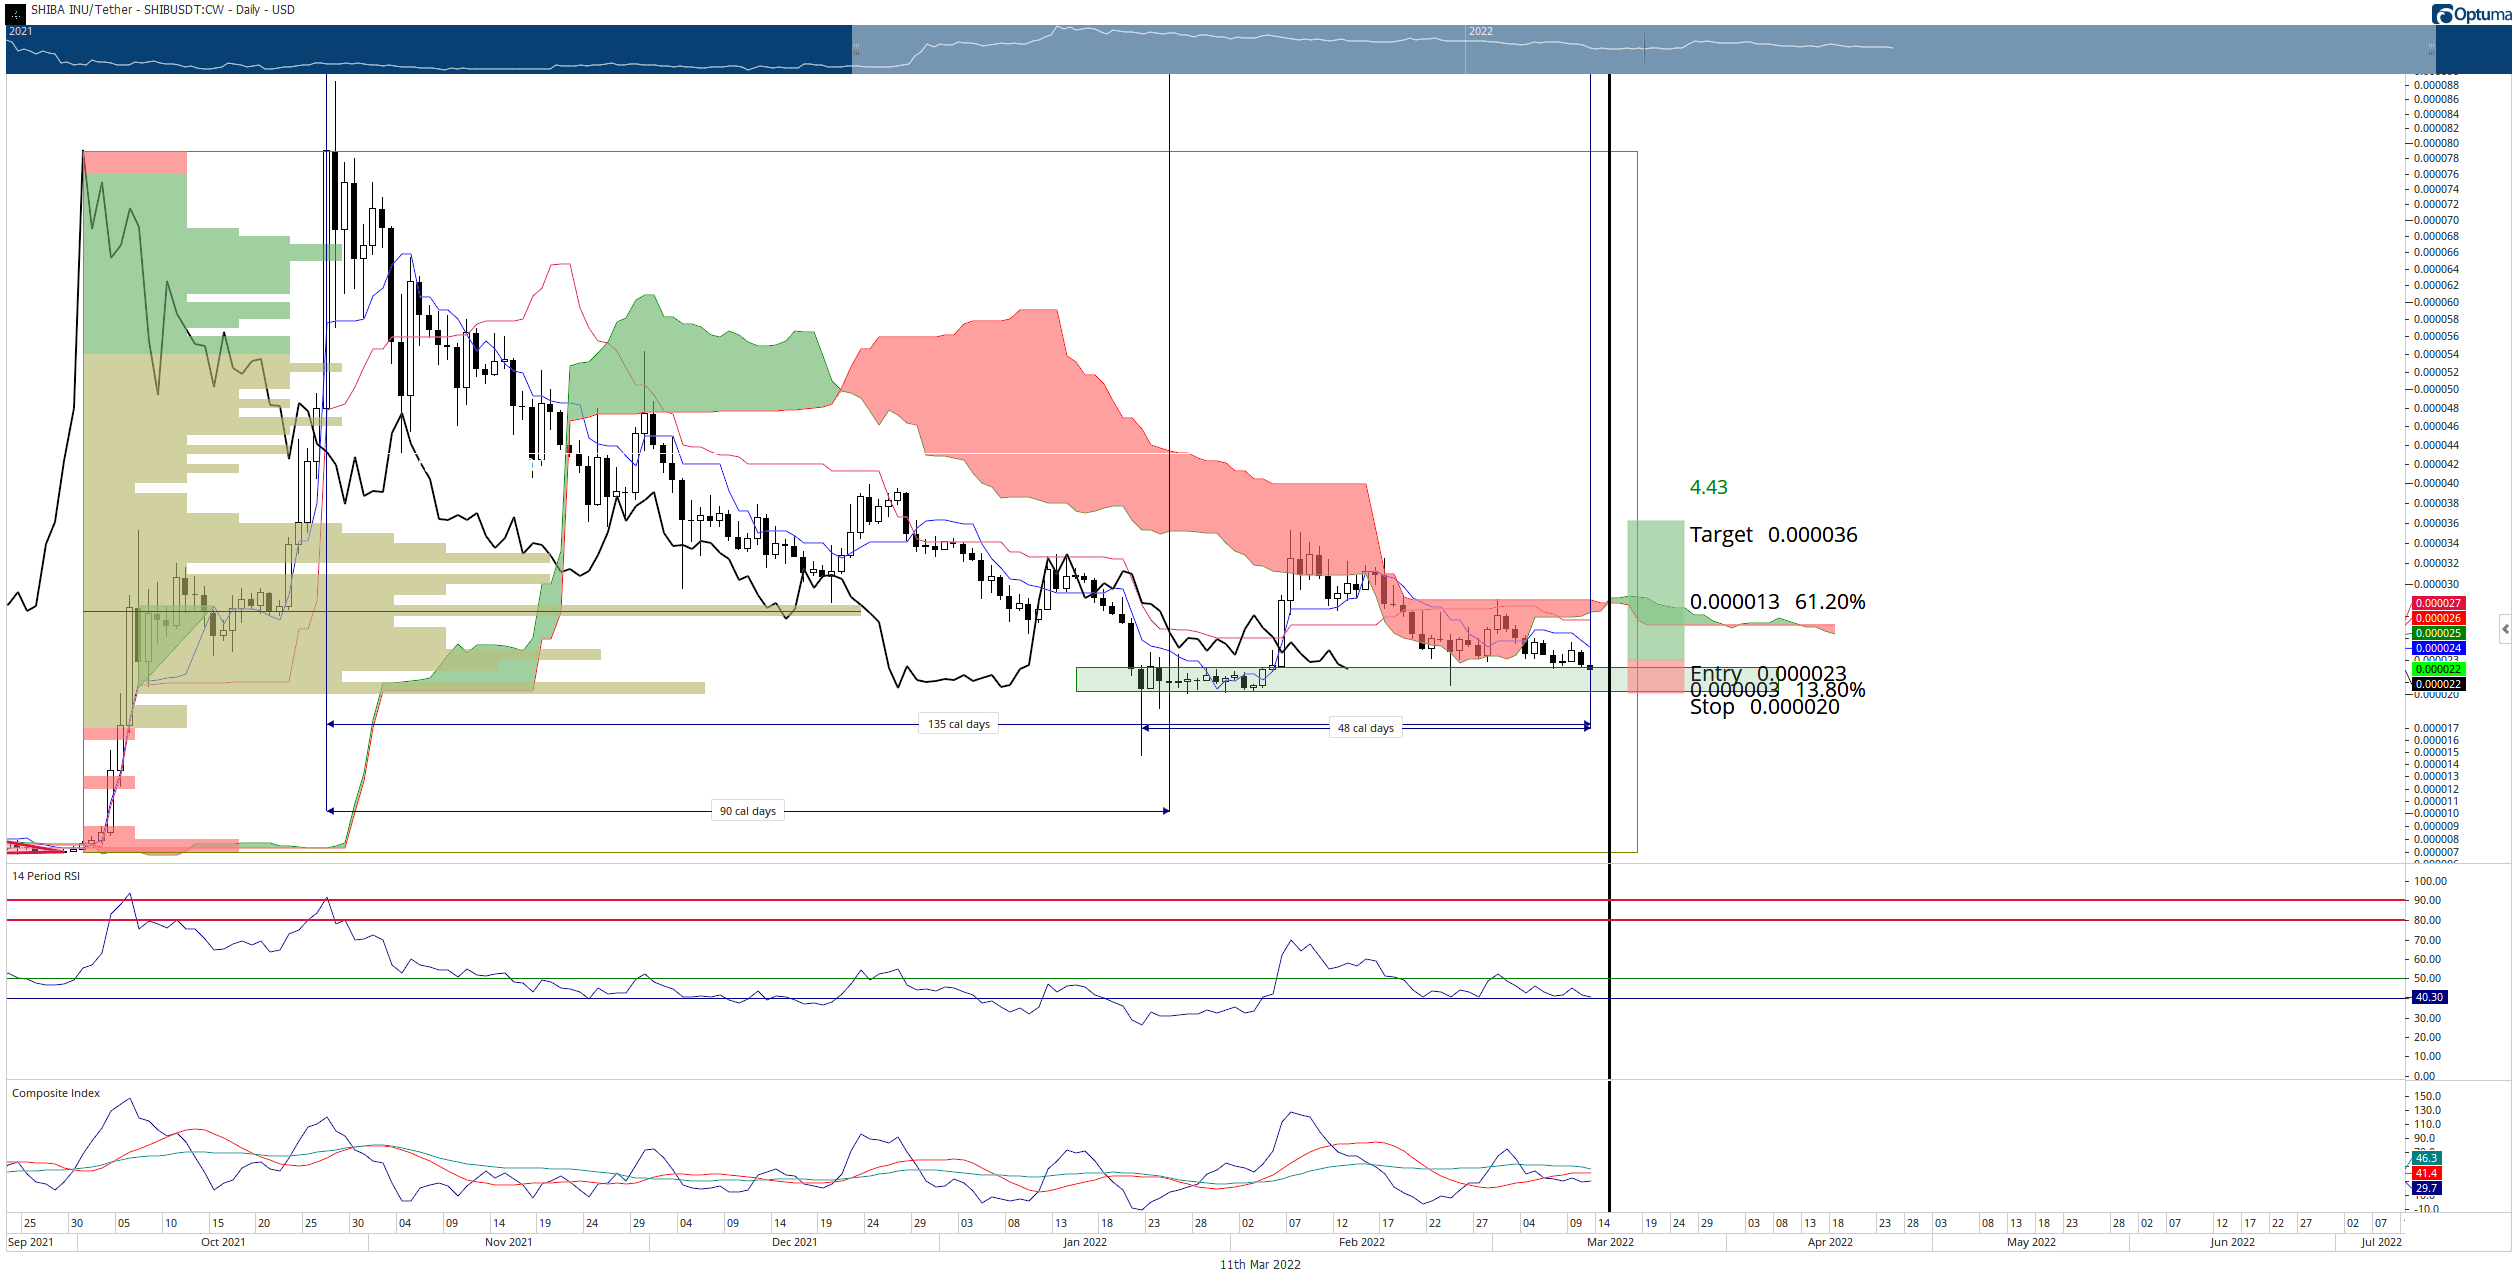
SHIBA/USDT Daily Ichimoku Kinko Hyo Chart
The warning sign for traders and investors is that while all three-time cycles indicate a high probability of a bullish reversal, the 135-day cycle may trigger a lower low before the March 21 date.
The projected high on any breakout is the $0.000050 value area.
Downside risks are considerable, especially if the $0.000020 fails to hold as support. Shiba Inu price could collapse back down to the $0.000007 range in that scenario.
Author

Jonathan Morgan
Independent Analyst
Jonathan has been working as an Independent future, forex, and cryptocurrency trader and analyst for 8 years. He also has been writing for the past 5 years.


