Shiba Inu Price Prediction: SHIB exposes risk of 20% collapse
- Shiba Inu price has printed a chart pattern that suggests indecision between buyers and sellers.
- However, SHIB may be in danger of a 20% plunge as it slices below a crucial support boundary.
- The altcoin has little room to move on the upside, as Shiba Inu price faces multiple stiff hurdles.

Shiba Inu price action has been uneventful despite the recent crypto market rally led by Bitcoin. SHIB continues to consolidate as it moves sideways, and an indecisive technical pattern has emerged. The altcoin is now in danger of a significant move to the downside as it falters and slices below a major support level.
Shiba Inu price in danger of significant decline
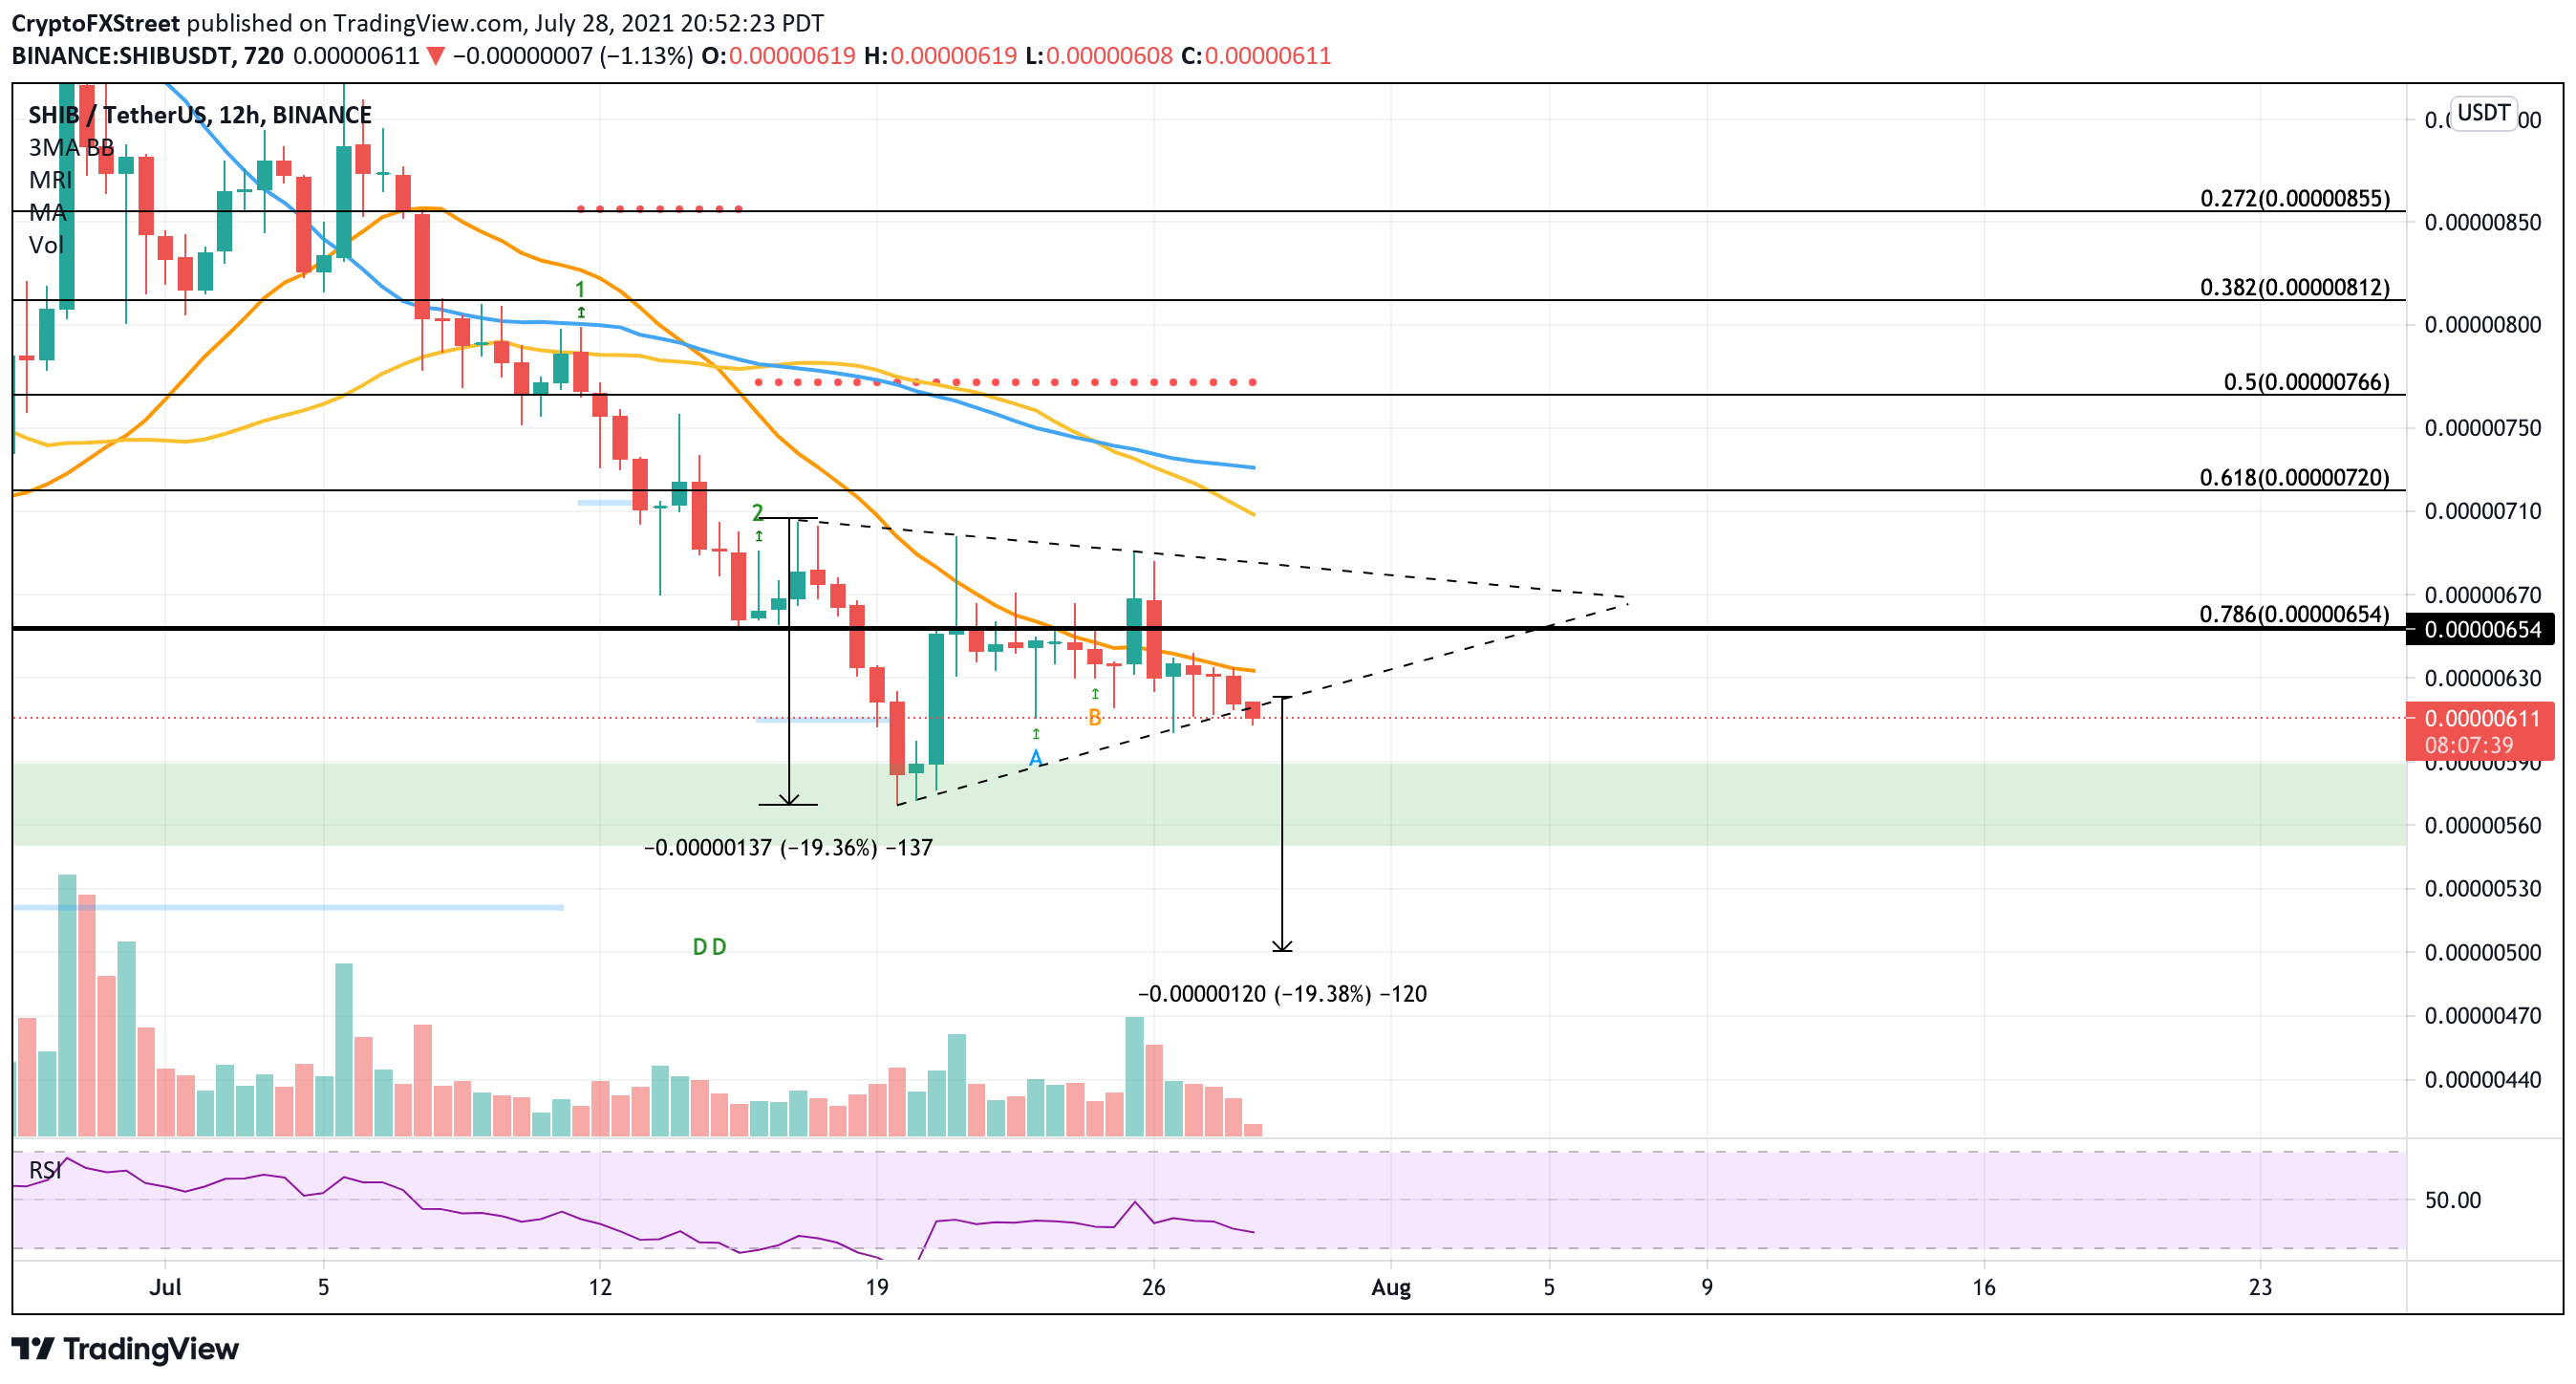
Shiba Inu price has presented a symmetrical triangle pattern on the 12-hour chart, suggesting that SHIB will continue to move sideways.
The lower highs and higher lows recorded by SHIB create two major trend lines that connect at the apex, forming a symmetrical triangle chart pattern.
Although the prevailing chart pattern suggests that the altcoin is indecisive, Shiba Inu price is now at the precipice of further decline, as SHIB sliced below the critical lower trend line that forms the bottom of the triangle.
The measured move of the governing technical pattern suggests that the canine-themed token is susceptible to a 19% plunge, as the bears eye a target of $0.00000501.
However, only a close below $0.00000617, the diagonal support trend line, could suggest that the bearish SHIB forecast is in the offing.
SHIB/USDT 12-hour chart
Shiba Inu price could attempt to recover support at the demand barrier that extends from $0.00000551 to $0.00000590, before plunging to the aforementioned target given by the chart pattern.
Should Shiba Inu price manage to close above the lower boundary of the triangle, SHIB would still see tough challenges ahead. The 20-day Simple Moving Average (SMA) continues to act as stiff resistance for the dog-themed token.
Even if the buying pressure were to see a spike, SHIB would be met with another strong obstacle as the 78.6% Fibonacci retracement level at $0.00000654 acts as the next hurdle for Shiba Inu price.
Should buyers manage to lift prices higher against the overpowering distribution of the sellers, SHIB bulls could target the upper boundary of the triangle at $0.00000682 to effect the reversal of fortune. Only a close above this level could introduce bigger aspirations for Shiba Inu price.
Author

Sarah Tran
Independent Analyst
Sarah has closely followed the growth of blockchain technology and its adoption since 2016.