Shiba Inu Price Prediction: SHIB at edge of 20% ascent if bulls conquer last hurdle
- Shiba Inu price is preparing for a 20% rally once it overcomes one last obstacle.
- SHIB needs to slice above the prevailing chart pattern’s neckline at $0.00002946 before ascending to the October 7 high.
- If Shiba Inu falls below $0.00002712, the token would fall back into a consolidation pattern, continuing to trend sideways.
Shiba Inu price continues to consolidate as it moves sideways following the tremendous bull run earlier this month. SHIB has presented a buying opportunity as it edges closer to a 20% rally following the emergence of a bullish technical pattern.
Shiba Inu price awaits climb toward $0.00003543
Shiba Inu price has formed an inverse head-and-shoulders pattern on the 4-hour chart. The prevailing technical pattern suggests a 20% breakout toward $0.00003543, the October 7 high, once SHIB surges above the neckline of the chart pattern at $0.00002946. Until the dog-themed token is able to slice above this one last obstacle, it may continue to trend sideways.
Adding credence to the bullish outlook is the break above the descending resistance trend line that formed since the swing high on October 7. However, before Shiba Inu price could reach the aforementioned optimistic target, there remain two major hurdles: the October 13 high and the October 11 high at $0.00003073 and $0.00003200, respectively.
Shiba Inu price appears to be also devising a symmetrical triangle pattern, with a measured 42% rally if SHIB makes a decisive move toward the upside. Although the token broke above the resistance trend line, it appears to be hovering around the topside trend line of the triangle pattern.
A spike in buy orders could see Shiba Inu price slice above the inverse head-and-shoulders neckline and eventually prepare for a 20% rally.
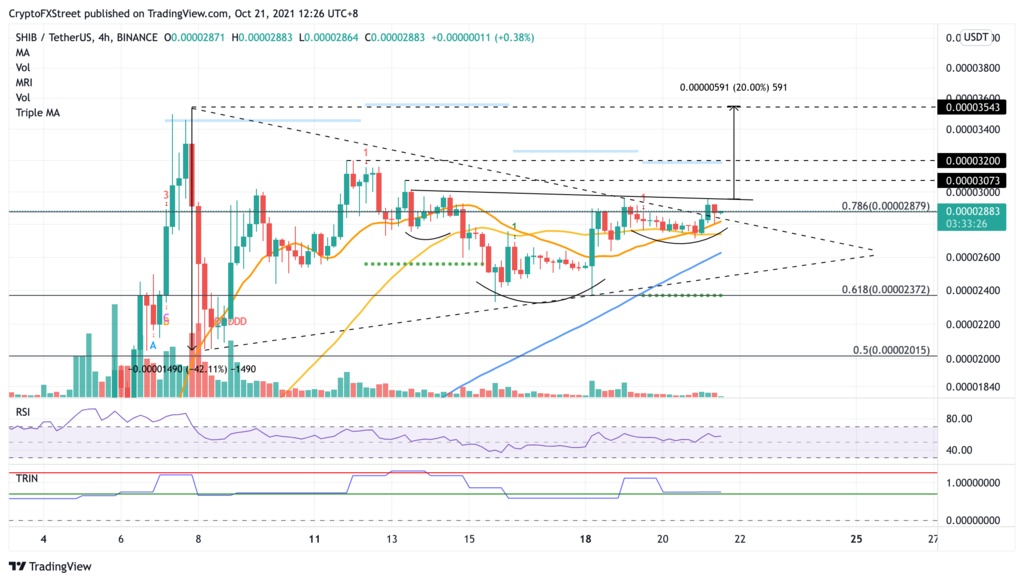
SHIB/USDT 4-hour chart
However, if SHIB suffers weakness and sees its momentum flip to the downside, Shiba Inu price could drop toward the prevailing chart pattern’s right shoulder, ruining the bullish outlook.
The first line of defense for Shiba Inu price is at the descending trend line, which coincides with the 21 four-hour Simple Moving Average (SMA) at $0.00002826. Additional support will emerge at the 50 four-hour SMA at $0.00002739, before dropping to the right shoulder’s low at $0.00002712. Should SHIB tumble below this level, the token would devastate bulls as the token falls back into the symmetrical triangle pattern, indicating further consolidation.
Additional selling pressure could see Shiba Inu price collapse toward the 100 four-hour SMA at $0.00002626, before descending further, tagging the ascending support trend line at $0.00002497.
Author

Sarah Tran
Independent Analyst
Sarah has closely followed the growth of blockchain technology and its adoption since 2016.


