Shiba Inu Price Prediction: Profit taking could drag SHIB price 15% down
- Shiba Inu price is moving sideways within a rectangle pattern.
- SHIB holders consider booking early profits, citing massive resistance at $0.00001303
- Holding above the 50-day EMA could invalidate the pessimistic outlook for SHIB price.
Shiba Inu price appears to be consolidating between a horizontal support and resistance. Its recent breakout elevated the second-largest meme coin to highs marginally above $0.00001500. However, SHIB price retreated as investors booked profits. For now, eyes are set on the next direction Shiba Inu will likely take, especially with the risk of a 15% drop becoming apparent.
Shiba Inu price is stuck in consolidation, but not for long
Shiba Inu price is consolidating within the confines of a rectangle pattern. There is buying pressure, but more is needed to burst SHIB on a northbound move.
Sellers will be ready to play if Shiba Inu price fails to hold above the most crucial support, as highlighted by the 50-day Exponential Moving Average (EMA) (in red).
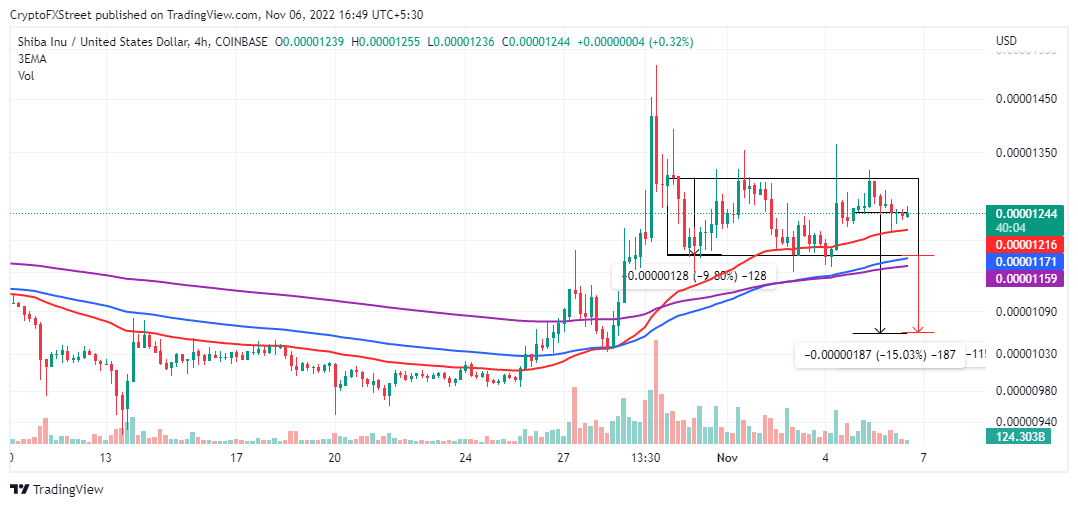
SHIB/USD daily chart
A rectangle pattern appearing on the chart is assumed neutral until Shiba Inu price makes a clear break above or below it. The downtrend preceding the rectangle could increase the chances of SHIB dropping 15% from its current market value.
Traders scanning for short positions must consider Shiba Inu price untradeable until it makes a clean break below the 50-day EMA. An ideal signal would be a break below the rectangle support at $0.00001277 ahead of a 9.80% profit target of $0.00001061.
A bullish breakout in Shiba Inu price is doubtful, especially if the Market Value Realized Value (MVRV) profit model is considered. From the chart below, most SHIB holders realize profits and are likely to sell to lock in the gains while waiting for suitable entry positions downstream.
 [14.20.15, 06 Nov, 2022]-638033316503228140.png)
Shiba Inu MVRV
The MVRV tracks the profit or loss ratio of Shiba Inu holders by taking the price at which the tokens last moved and comparing it to their current market value. Readings above 1 hint at an overvalued asset, often resulting in a spike in overhead pressure.
On the flip side, traders cannot rule out a potential breakout equal to the rectangle's width, extrapolated from the breakout point at $0.00001303. Bulls must start with defending support provided by the 50-day EMA to ensure this breakout materializes.
Author

John Isige
FXStreet
John Isige is a seasoned cryptocurrency journalist and markets analyst committed to delivering high-quality, actionable insights tailored to traders, investors, and crypto enthusiasts. He enjoys deep dives into emerging Web3 tren


