Shiba Inu Price Forecast: SHIB plots a new opportunity, targets a 35% gain
- Shiba Inu price continues to consolidate the August 7-8 burst higher as the action begins to take the shape of a cup-with-handle base.
- Descending parallel channel’s upper line remains a technical obstacle as the consolidation matures.
- SHIB holds the 50-day simple moving average (SMA), creating a higher probability of continuing the rally.
Shiba Inu price is up 4.25% this week after rising 15.53% last week, maintaining the upward trajectory as it consolidates the gains. The emerging cup-with-handle base improves the probabilities that SHIB will resume the rally and test the previously suggested targets of $0.00001204 and $0.00001214.
Shiba Inu price consolidates above essential support
Since the close above the 50-day SMA on August 7, Shiba Inu price has opted to tread slightly higher on a daily closing basis, frustrated by the descending parallel channel’s upper line. However, the SHIB action could be shaping the handle of a bullish cup-with-handle base that began in late June and marked a low in July.
The measured move of the SHIB cup-with-handle base, as calculated from the handle high to the cup low, is almost 36%, and it projects a Shiba Inu price target of $0.00001207. The target matches perfectly with the previously mentioned price targets of the May 24 high at $0.00001204 and the May 20 high at $0.00001214.
To realize the 36% measured move, Shiba Inu price needs a few more days of consolidation above the 50-day SMA to create better symmetry, which should include a daily SHIB close above the channel’s upper line around $0.00000765.
Once Shiba Inu price has triggered the cup-with-handle base at $0.00000887, it will encounter some resistance at the June 29 high of $0.00000962, followed by a layer of swing highs at $0.00000986 and $0.00001048.
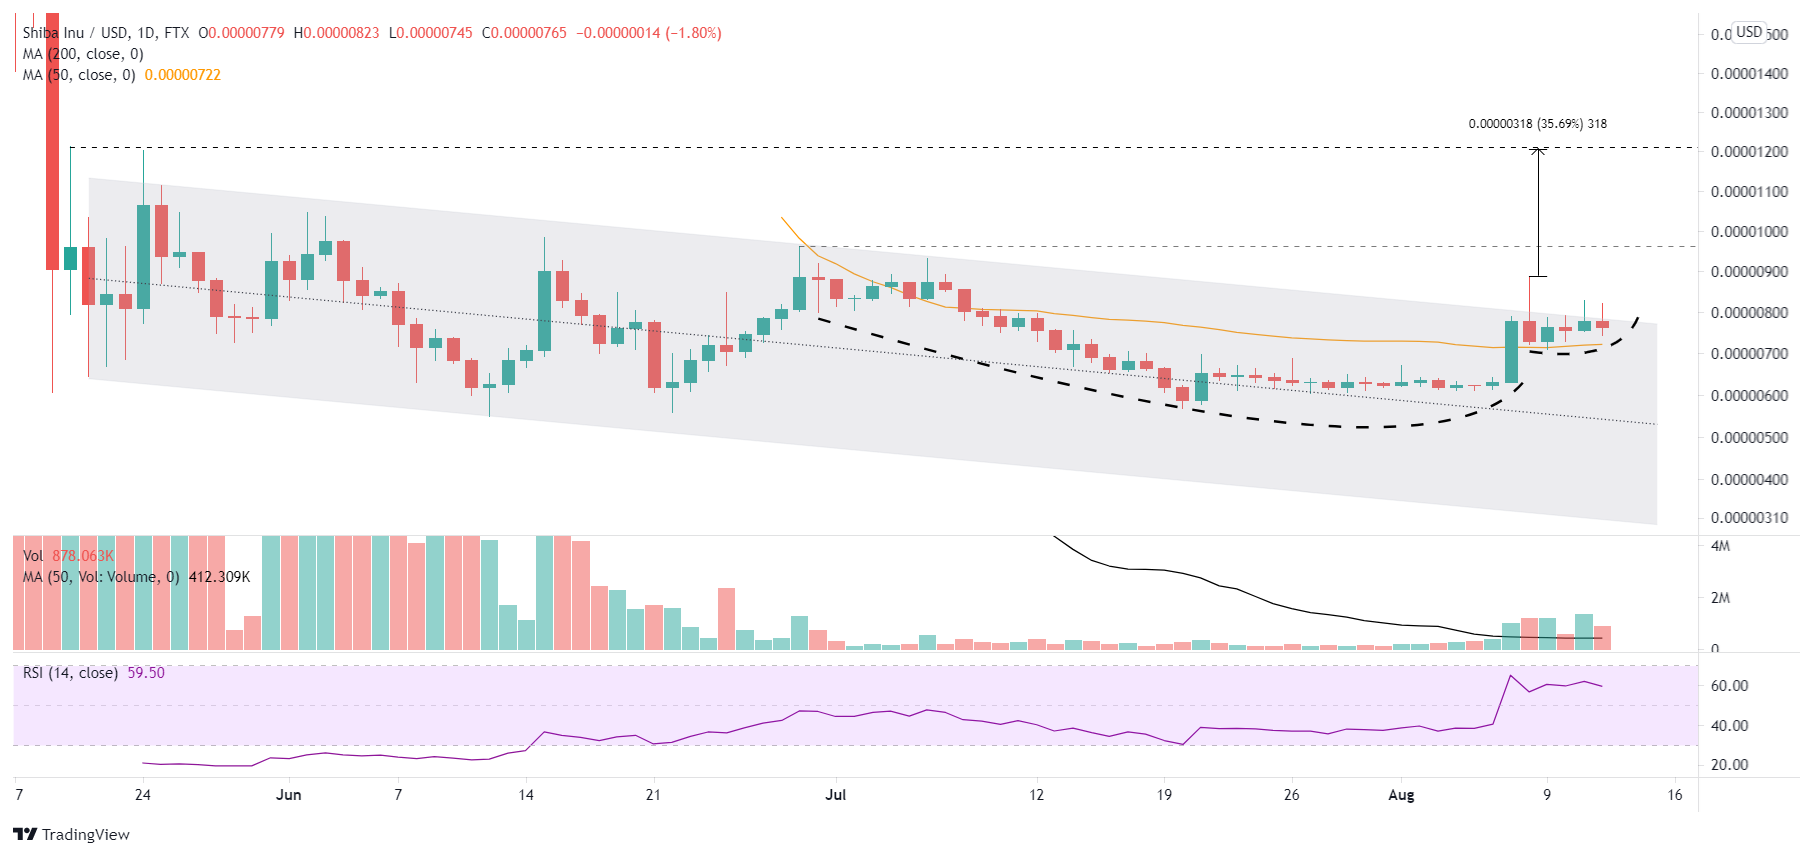
SHIB/USD daily chart
A daily close below the 50-day SMA at $0.00000722 would be a blow to the emerging Shiba Inu price structure, increasing the pressure on SHIB to test the instrumental support at the May 19 low of $0.00000607. This level guided Shiba Inu price from July 22 to August 6.
Additional support materializes around the confluence of the descending parallel channel’s midline at $0.00000548 and the June 12 low of $0.00000550.
The Shiba Inu price event on August 7 and August 8 of 40% may have been a transformative moment for the meme token after spending weeks hovering above the crucial May 19 low. Now, SHIB is positioning for higher prices in a constructive base with a concise entry price, presenting a unique opportunity for SHIB speculators to participate in a 36% rally.
Here, FXStreet's analysts evaluate where SHIB could be heading next as it tests critical resistance.
Author

Sheldon McIntyre, CMT
Independent Analyst
Sheldon has 24 years of investment experience holding various positions in companies based in the United States and Chile. His core competencies include BRIC and G-10 equity markets, swing and position trading and technical analysis.


