Shiba Inu Price Forecast: Faces a pullback amid profit-taking after testing resistance level
- Shiba Inu’s price hovers around $0.000024 on Wednesday after being rejected from the weekly resistance level earlier this week.
- On-chain data shows SHIB holders are booking profit from recent gains, raising the selling pressure.
- A daily candlestick close above $0.000028 would invalidate the bearish thesis.

Shiba Inu (SHIB) price hovers around $0.000024 on Wednesday after rejection from the weekly resistance level earlier this week. On-chain data supports a bearish outlook as SHIB holders realize profits from recent gains and raise the selling pressure, suggesting a further down leg for the memecoin price.
SHIB shows signs of weakness
Shiba Inu price faced resistance at the weekly level of $0.000028 on Sunday and declined 6% until Tuesday. This weekly level coincides with the 50% price retracement (drawn from the March high of $0.000045 to the August low of $0.000010), making it a key resistance zone. At the time of writing on Wednesday, SHIB hovers around $0.000024.
If SHIB continues to decline and closes below the $0.000022 support level, it could extend the decline to restest its next weekly support at $0.000019.
The Relative Strength Index (RSI) indicator on the daily chart also fell from the overbought level of 70 on November 13 and currently reads 57, pointing downwards and indicating weakness in momentum. If the RSI closes below the neutral value of 50 on a daily basis, it would suggest a sharp fall in Shiba Inu price.
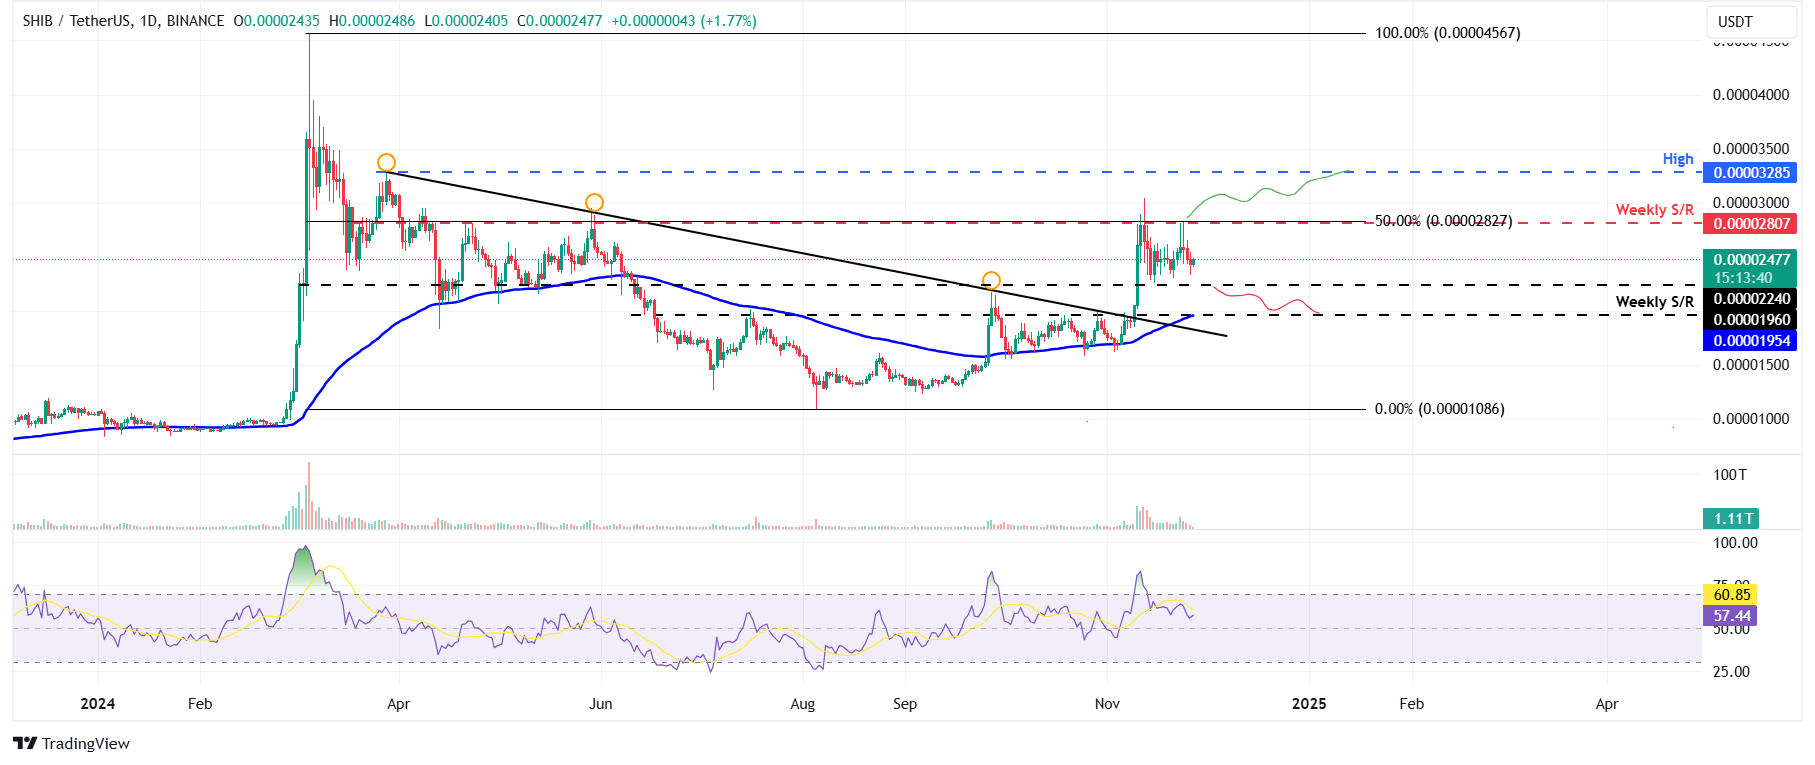
SHIB/USDT daily chart
Looking down on Shiba Inu’s on-chain metric further projects a bearish outlook. Santiment’s Network Realized Profit/Loss (NPL) indicator computes a daily network-level Return On Investment (ROI) based on the coin’s on-chain transaction volume. Simply put, it is used to measure market pain. Strong spikes in a coin’s NPL indicate that its holders are, on average, selling their bags at a significant profit. On the other hand, strong dips imply that the coin’s holders are, on average, realizing losses, suggesting panic sell-offs and investor capitulation.
In SHIB’s case, the metric spiked almost 32 times from 1.61 million to 51.33 million from Sunday to Tuesday; a similar spike was seen recently on November 11, after which the memecoin declined 16% in the next three days. If history repeats, the prices could decline in the upcoming days.
%20[11.04.40,%2027%20Nov,%202024]-638683021053848570.png)
SHIB Network Realized Profit/Loss chart. Source: Santiment
IntoTheBlock’s In/Out of the Money Around Price (IOMAP) further supports the bearish outlook. Nearly 40,830 addresses accumulated 53.41 trillion SHIB tokens at an average price of $0.000025. These addresses bought the memecoin around the $0.000025 level, and if the price rises to this level, investors could sell their token to get out at breakeven, thus making this level a key resistance zone.
From a technical analysis perspective, the $0.000028 level roughly coincides with the IOMAP findings, making this zone a key reversal level to watch for.
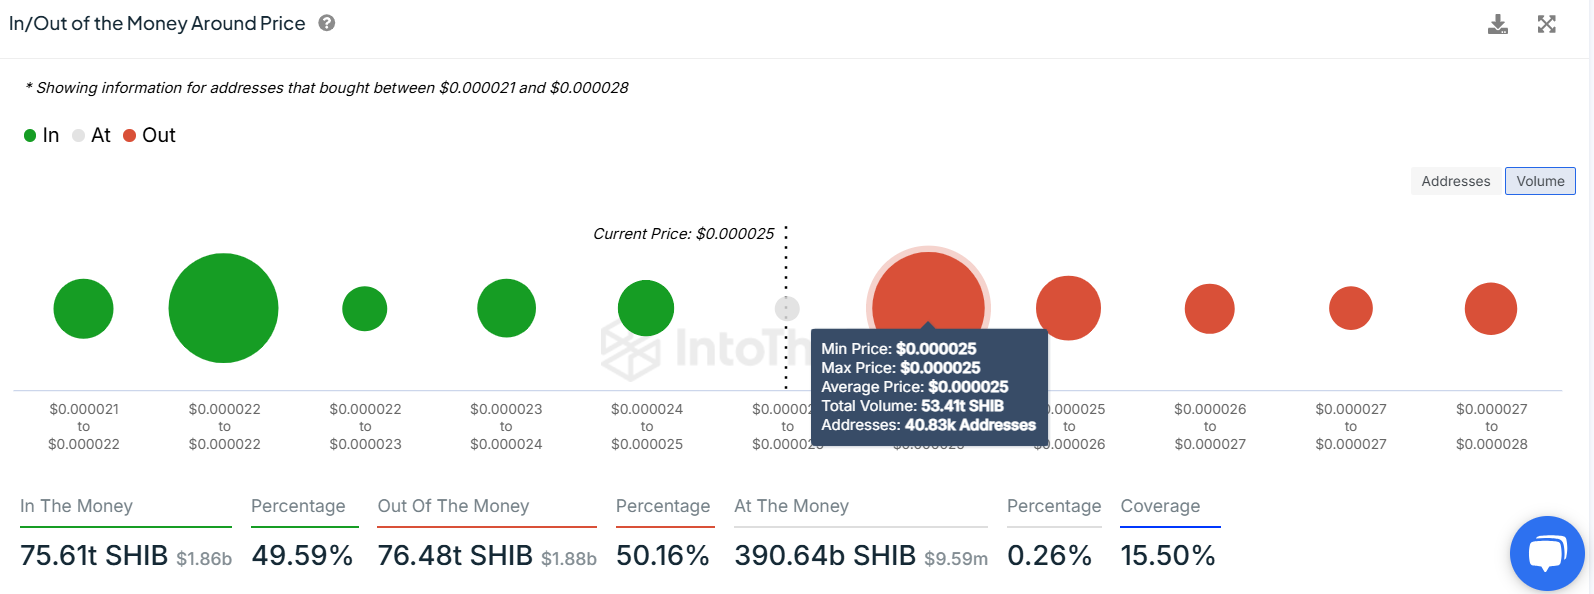
SHIB IOMAP chart. Source: IntoTheBlock
Even though on-chain metrics and technical analysis support the bearish outlook, if the SHIB daily candlestick closes above the $0.000028 weekly resistance level, the bearish thesis will be invalidated, leading to a price rally to retest its end-March weekly high of $0.000032.
Author

Manish Chhetri
FXStreet
Manish Chhetri is a crypto specialist with over four years of experience in the cryptocurrency industry.


