Shiba Inu holders withdraw 1.67 trillion SHIB tokens from exchange
- Shiba Inu’s price retraces after testing its weekly resistance level.
- On-chain data paints a bullish picture, as SHIB’s exchange outflow shows a spike, and dormant wallets are on the move.
- A weekly candlestick close below $0.000019 would invalidate the bullish thesis.
Shiba Inu (SHIB) trades slightly higher, around $0.000024, on Thursday after declining more than 5% the previous week. SHIB’s on-chain metrics project a bullish outlook as holders accumulate recent dips, and dormant wallets are on the move, all pointing to a recovery in the cards.
Shiba Inu investors accumulate on the dips
Shiba Inu price faces a corrective pullback after surging more than 50% in early November. However, its on-chain metrics suggest a bullish outlook ahead. Santiment’s exchange outflow data shows a massive spike, indicating that 1.67 trillion SHIB worth nearly $41 million has been withdrawn from exchanges. Historically, when SHIB experienced a similar spike in exchange outflow, the meme coin rallied massively.
%20[08.51.48,%2021%20Nov,%202024]-638677643692517085.png)
Shiba Inu Exchange outflow chart. Source: Santiment
Santiment’s Age Consumed index also aligns with the bullish outlook. Spikes in this index suggest dormant tokens (tokens stored in wallets for a long time) are in motion and can be used to spot short-term local tops or bottoms.
For Shiba Inu, history shows that the spikes were followed by a rally in meme coin prices. The most recent uptick on November 14 also forecasted that SHIB was ready for an uptrend.
%20[08.57.25,%2021%20Nov,%202024]-638677644023173959.png)
SHIB Age Consumed chart. Source: Santiment
Shiba Inu Price Forecast: A recovery on the cards
Shiba Inu price declined more than 5% after facing resistance around its weekly level of $0.000028 in the second week of November. The weekly resistance at $0.000028 coincides with the 50% price retracement level ( drawn from a March high of $0.000045 to an August low of $0.000010) at $0.000028, making it a key resistance zone. As of this week, the pullback continues, trading at around $0.000023.
If Shiba Inu breaks and closes above $0.000028, it will rally to retest its end-March weekly high of $0.000032.
The Relative Strength Index (RSI) on the weekly chart reads 59, above its neutral level of 50, indicating the bullish momentum is gaining traction.
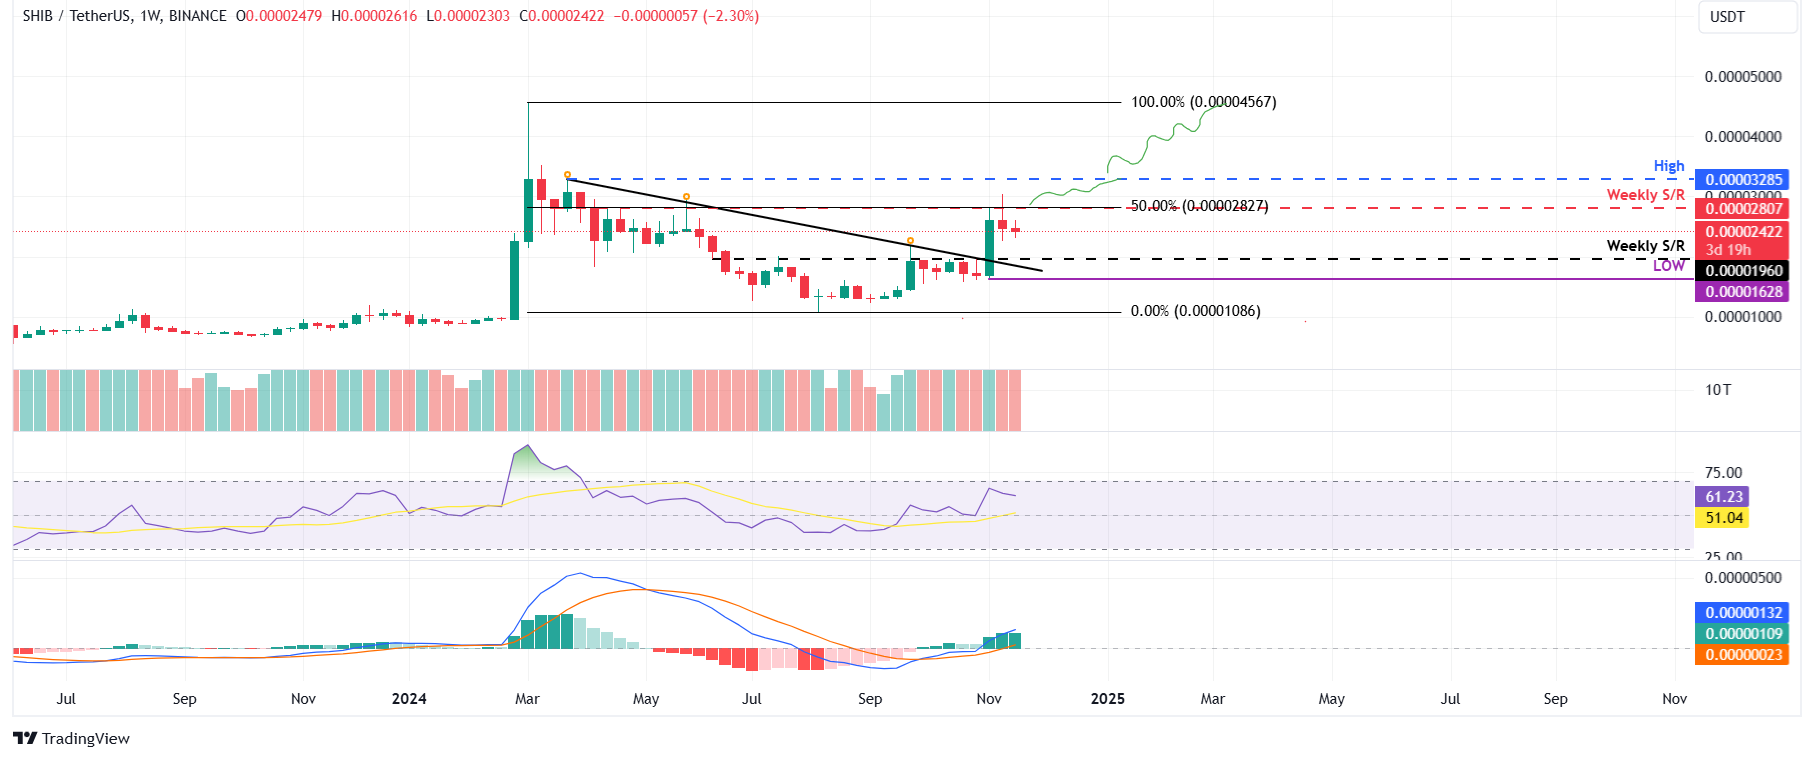
SHIB/USDT weekly chart
However, if SHIB continues the pullback and closes below $0.000019 weekly support, it will extend the decline to retest the weekly low of $0.000016.
Author

Manish Chhetri
FXStreet
Manish Chhetri is a crypto specialist with over four years of experience in the cryptocurrency industry.


