- Shiba Inu price is stuck hovering around two vital support levels, $0.00000625 and $0.00000654.
- SHIB is now an asset supported by Coinbase Custody.
- A successful flip above $0.00000654 might trigger a 32% upswing.
Shiba Inu price is in a tough place that becomes apparent as it failed to move despite Coinbase inducting SHIB into Coinbase Custody. The consolidation around two critical support levels has been ongoing for roughly two weeks now and shows no signs of a breakout.
Coinbase Custody welcomes Shiba Inu
Coinbase, one of US's most popular cryptocurrency exchanges, announced on August 3 that it would accept Shiba Inu into Coinbase Custody. Although a lot of the retail market expected this news to move the market, it did not, suggesting that the hype cycle for meme coins has died.
Regardless, this move from Coinbase indicates that investors on its platform are actively holding their purchases, be it Shiba Inu or other cryptocurrencies, and they want a safer place to store their assets, which explains the announcement.
Despite this development being fundamentally positive for the dog-themed cryptocurrency, its effect on the market value seems to have been delayed. On the other hand, technicals also indicate an incoming bullish breakout. Therefore, going forward, investors can expect a massive spike in buying pressure that results in an exponential growth in Shiba Inu price.
Shiba Inu price awaits a trigger
Shiba Inu price is currently hovering around the $0.00000654 and $0.00000625 support levels. These barriers came into existence on May 19 and June 8, respectively. Since then, any breach below these footholds was followed by a successful flip, resulting in a massive spike in buying pressure (circled areas).
However, unlike previous instances, SHIB has failed to react after a reclaim of $0.00000654. Moreover, the last time Shiba Inu price consolidated for over two weeks was just before the 2,933% upswing between May 7 to May 10.
All in all, the compression that Shiba Inu price is undergoing indicates that it will result in a bullish breakout that retests the 50% Fibonacci retracement level at $0.00000870.
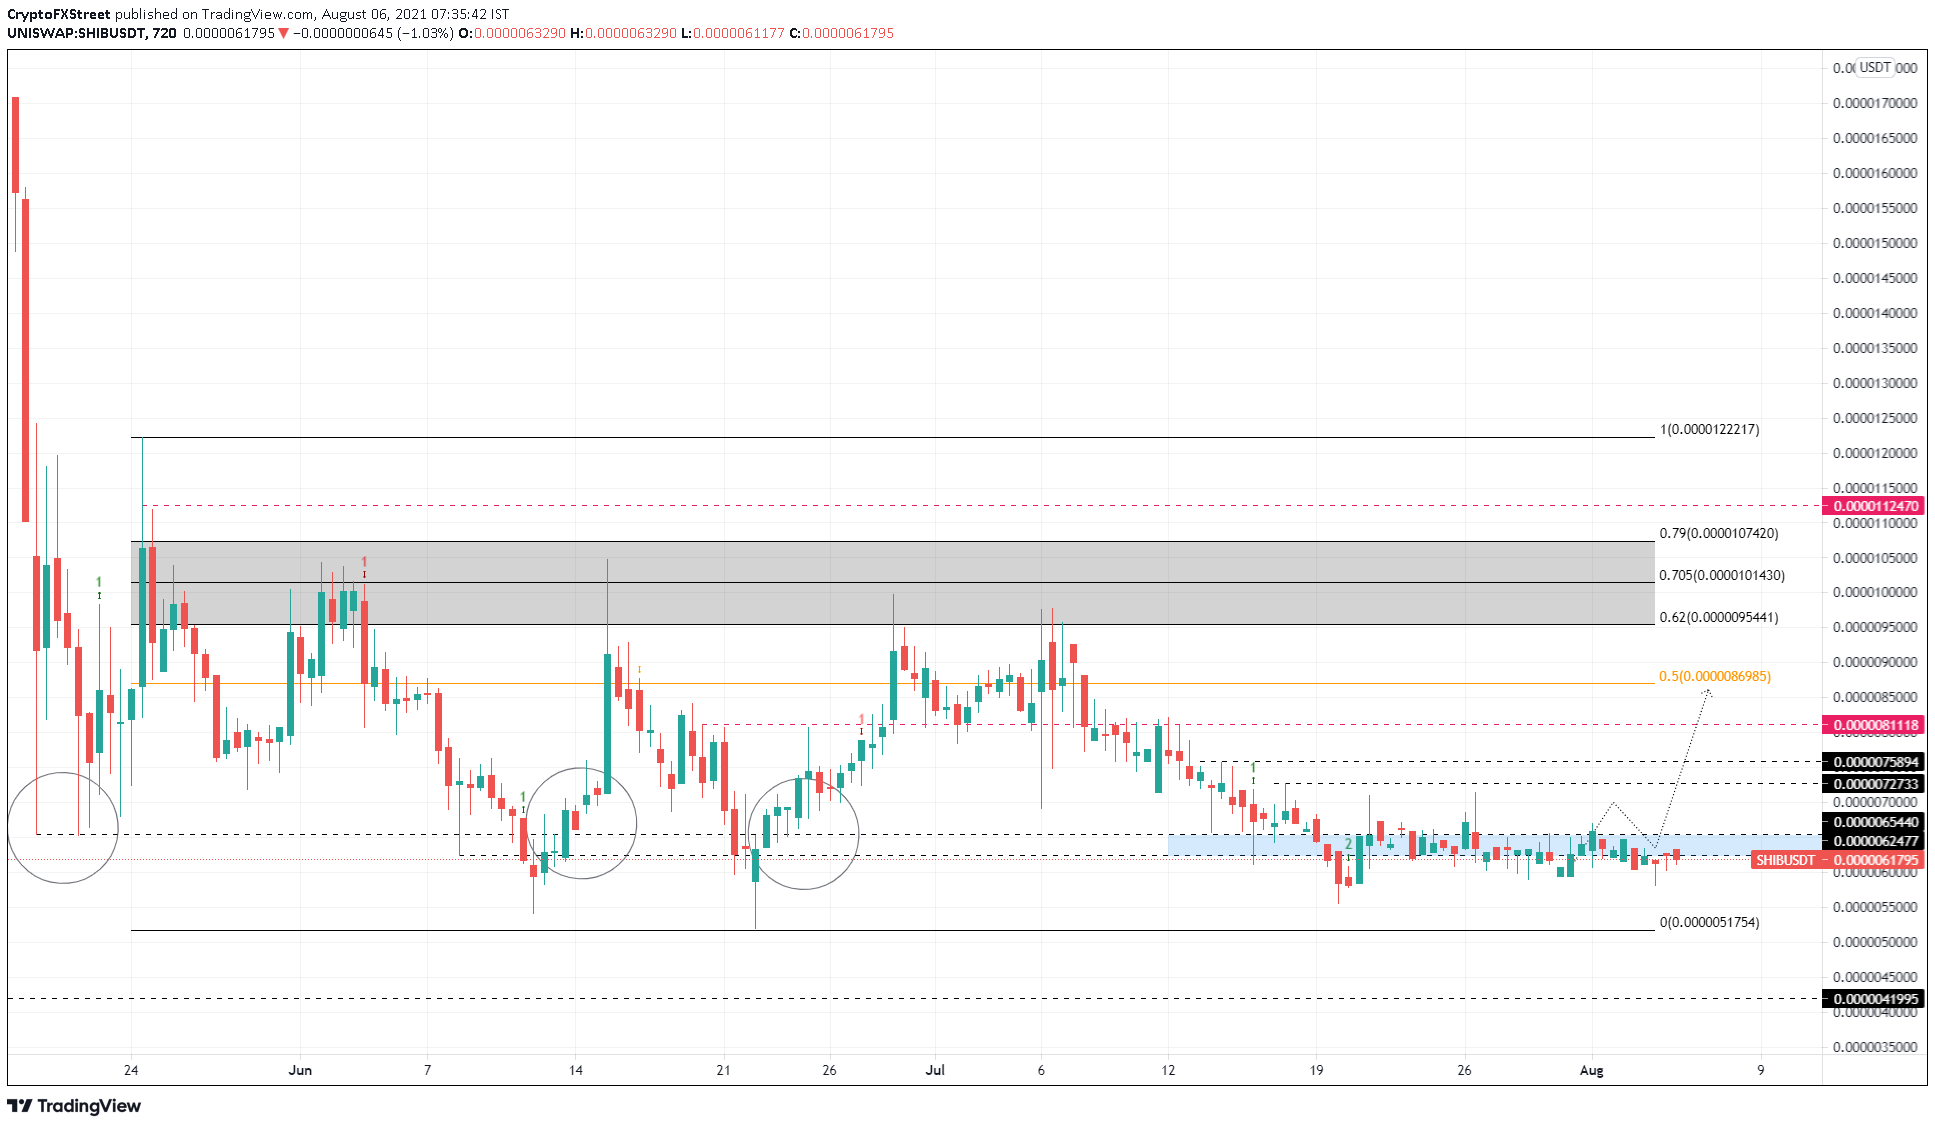
SHIB/USDT 12-hour chart
On the other hand, an inability of the buyers to reclaim $0.00000654 will indicate a weak bullish momentum. This development will result in a 17% downswing to retest the range low at $0.00000517.
If the sellers push SHIB below $0.00000517, it will invalidate the bullish thesis and potentially trigger further downside to $0.00000420.
Information on these pages contains forward-looking statements that involve risks and uncertainties. Markets and instruments profiled on this page are for informational purposes only and should not in any way come across as a recommendation to buy or sell in these assets. You should do your own thorough research before making any investment decisions. FXStreet does not in any way guarantee that this information is free from mistakes, errors, or material misstatements. It also does not guarantee that this information is of a timely nature. Investing in Open Markets involves a great deal of risk, including the loss of all or a portion of your investment, as well as emotional distress. All risks, losses and costs associated with investing, including total loss of principal, are your responsibility. The views and opinions expressed in this article are those of the authors and do not necessarily reflect the official policy or position of FXStreet nor its advertisers. The author will not be held responsible for information that is found at the end of links posted on this page.
If not otherwise explicitly mentioned in the body of the article, at the time of writing, the author has no position in any stock mentioned in this article and no business relationship with any company mentioned. The author has not received compensation for writing this article, other than from FXStreet.
FXStreet and the author do not provide personalized recommendations. The author makes no representations as to the accuracy, completeness, or suitability of this information. FXStreet and the author will not be liable for any errors, omissions or any losses, injuries or damages arising from this information and its display or use. Errors and omissions excepted.
The author and FXStreet are not registered investment advisors and nothing in this article is intended to be investment advice.
Recommended Content
Editors’ Picks
XRP price extends losses on Tuesday, risks decline below support at $0.60
XRP price dropped closer to its psychologically important support level at $0.60 on Tuesday amidst a steep correction in the crypto ecosystem. Most of the top 30 cryptocurrencies by market capitalization have noted a decline in their prices on March 19.
Avalanche price could rise 20% on gaming narrative ahead of GDC conference
Avalanche is an outlier on Monday, rallying while the broader market crashes. It has outperformed Bitcoin price, as well as meme and AI crypto coins, sectors that have been thriving of late. AVAX’s good fortune comes ahead of the Game Developers Conference.
Bitcoin price shows weakness, but new BTC whales have created solid support at $56,400
Bitcoin downside momentum strengthens, giving sidelined and late bulls a chance to buy the dip. The market remains focussed on the oncoming halving, expected to kick off the next bull cycle.
Crypto AI token rally persists, ignited by NVIDIA AI conference
NVIDIA AI conference, starting on Monday, is considered a key AI event as market participants await the unveiling of the next AI chip, B100. NVIDIA’s influence extends to the mining sector in crypto as its chips are focused on high-performance GPUs.
Bitcoin: Can BTC hit $100,000 without a correction?
Bitcoin (BTC) price shows a slowdown in momentum as it set up a new all-time high of $73,949 on March 13. Considering the massive uptrend that BTC has been experiencing, a short-term correction is nothing to be concerned about.