Bitcoin Price Forecast: BTC hits new all-time high, towards $100K or cycle top?

Bitcoin price today: $94,300
- Bitcoin reaches a new high of $94,750 on Wednesday and the technical outlook suggests a possible continuation of the rally to $100,000.
- Grayscale launches Bitcoin ETF options on Wednesday following BlackRock’s record launch the previous day.
- Traders should exercise caution as on-chain metrics suggest the possibility of a pullback.
Bitcoin (BTC) surged to a new high of $94,750 on Wednesday, buoyed by Grayscale’s launch of Bitcoin ETF options following BlackRock’s record-breaking debut on Tuesday. This fuels optimism for a rally toward $100,000, althoughcaution is advised as on-chain metrics hint at the potential for a pullback.
Bitcoin investors should hold or sell?
Bitcoin reached a new high of $94,750 on Wednesday, just over 5.5% from its $100K milestone. According to CoinMarketCap, Bitcoin is increasingly recognized as a legitimate asset class and has become the world’s seventh-largest asset with a market capitalization of $1.88 trillion. This mainstream acceptance attracts new investors, including those who have never bought Bitcoin.
Looking deeper into the Bitcoin on-chain metrics provides a clear picture of whether investors should hold or sell. According to CryptoQuant data, traders should exercise caution as the Realized Cap is no longer increasing –insufficient new money flow– signaling potential weakness in bullish momentum.
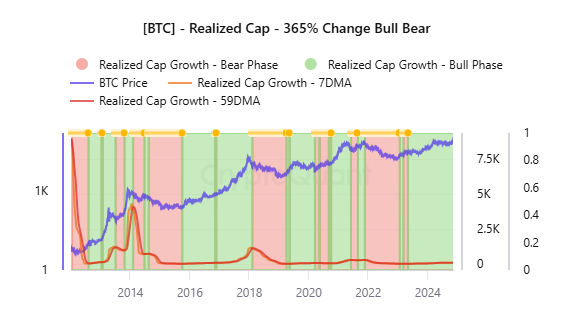
Bitcoin Realized Cap chart. Source: CryptoQuant
Bitcoin’s Coin Days Destroyed (CDD) has surged, indicating that many older coins are being reactivated. This is a strong signal of distribution, as long-term holders are selling. The reactivation of long-held Bitcoin often marks market tops. The CDD metric reads 15.14 million, exceeding the 15 to 20 million range, indicating a warning.
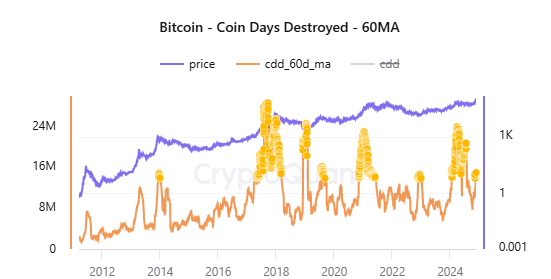
Bitcoin Coin Days Destroyed chart. Source: CryptoQuant
The Crypto Fear & Greed Index is a popular tool for gauging market sentiment, particularly greed. Generally, when the index exceeds a value of 80, caution is advised. As of Wednesday, the metric reads 90, indicating strong market greed. While markets can continue to rise during periods of high greed, this often signals that a top is near, increasing the likelihood of a pullback.
Despite the signals for a potential pullback, there are also signs of optimism that Bitcoin could hit $100K before peaking at current levels. Bitcoin’s Market Value to Realized Value (MVRV) metric shows the market’s profit or loss ratio. The metric current stands at 2.6, showing a high amount of unrealized profit but not a sign of a macro top.
Historically, whenever the MVRV reaches a value of 4, it has signaled a long-term market top. When the MVRV hits this threshold, it is a strong indication to sell. This suggests that Bitcoin could hit $100K before peaking at current levels.
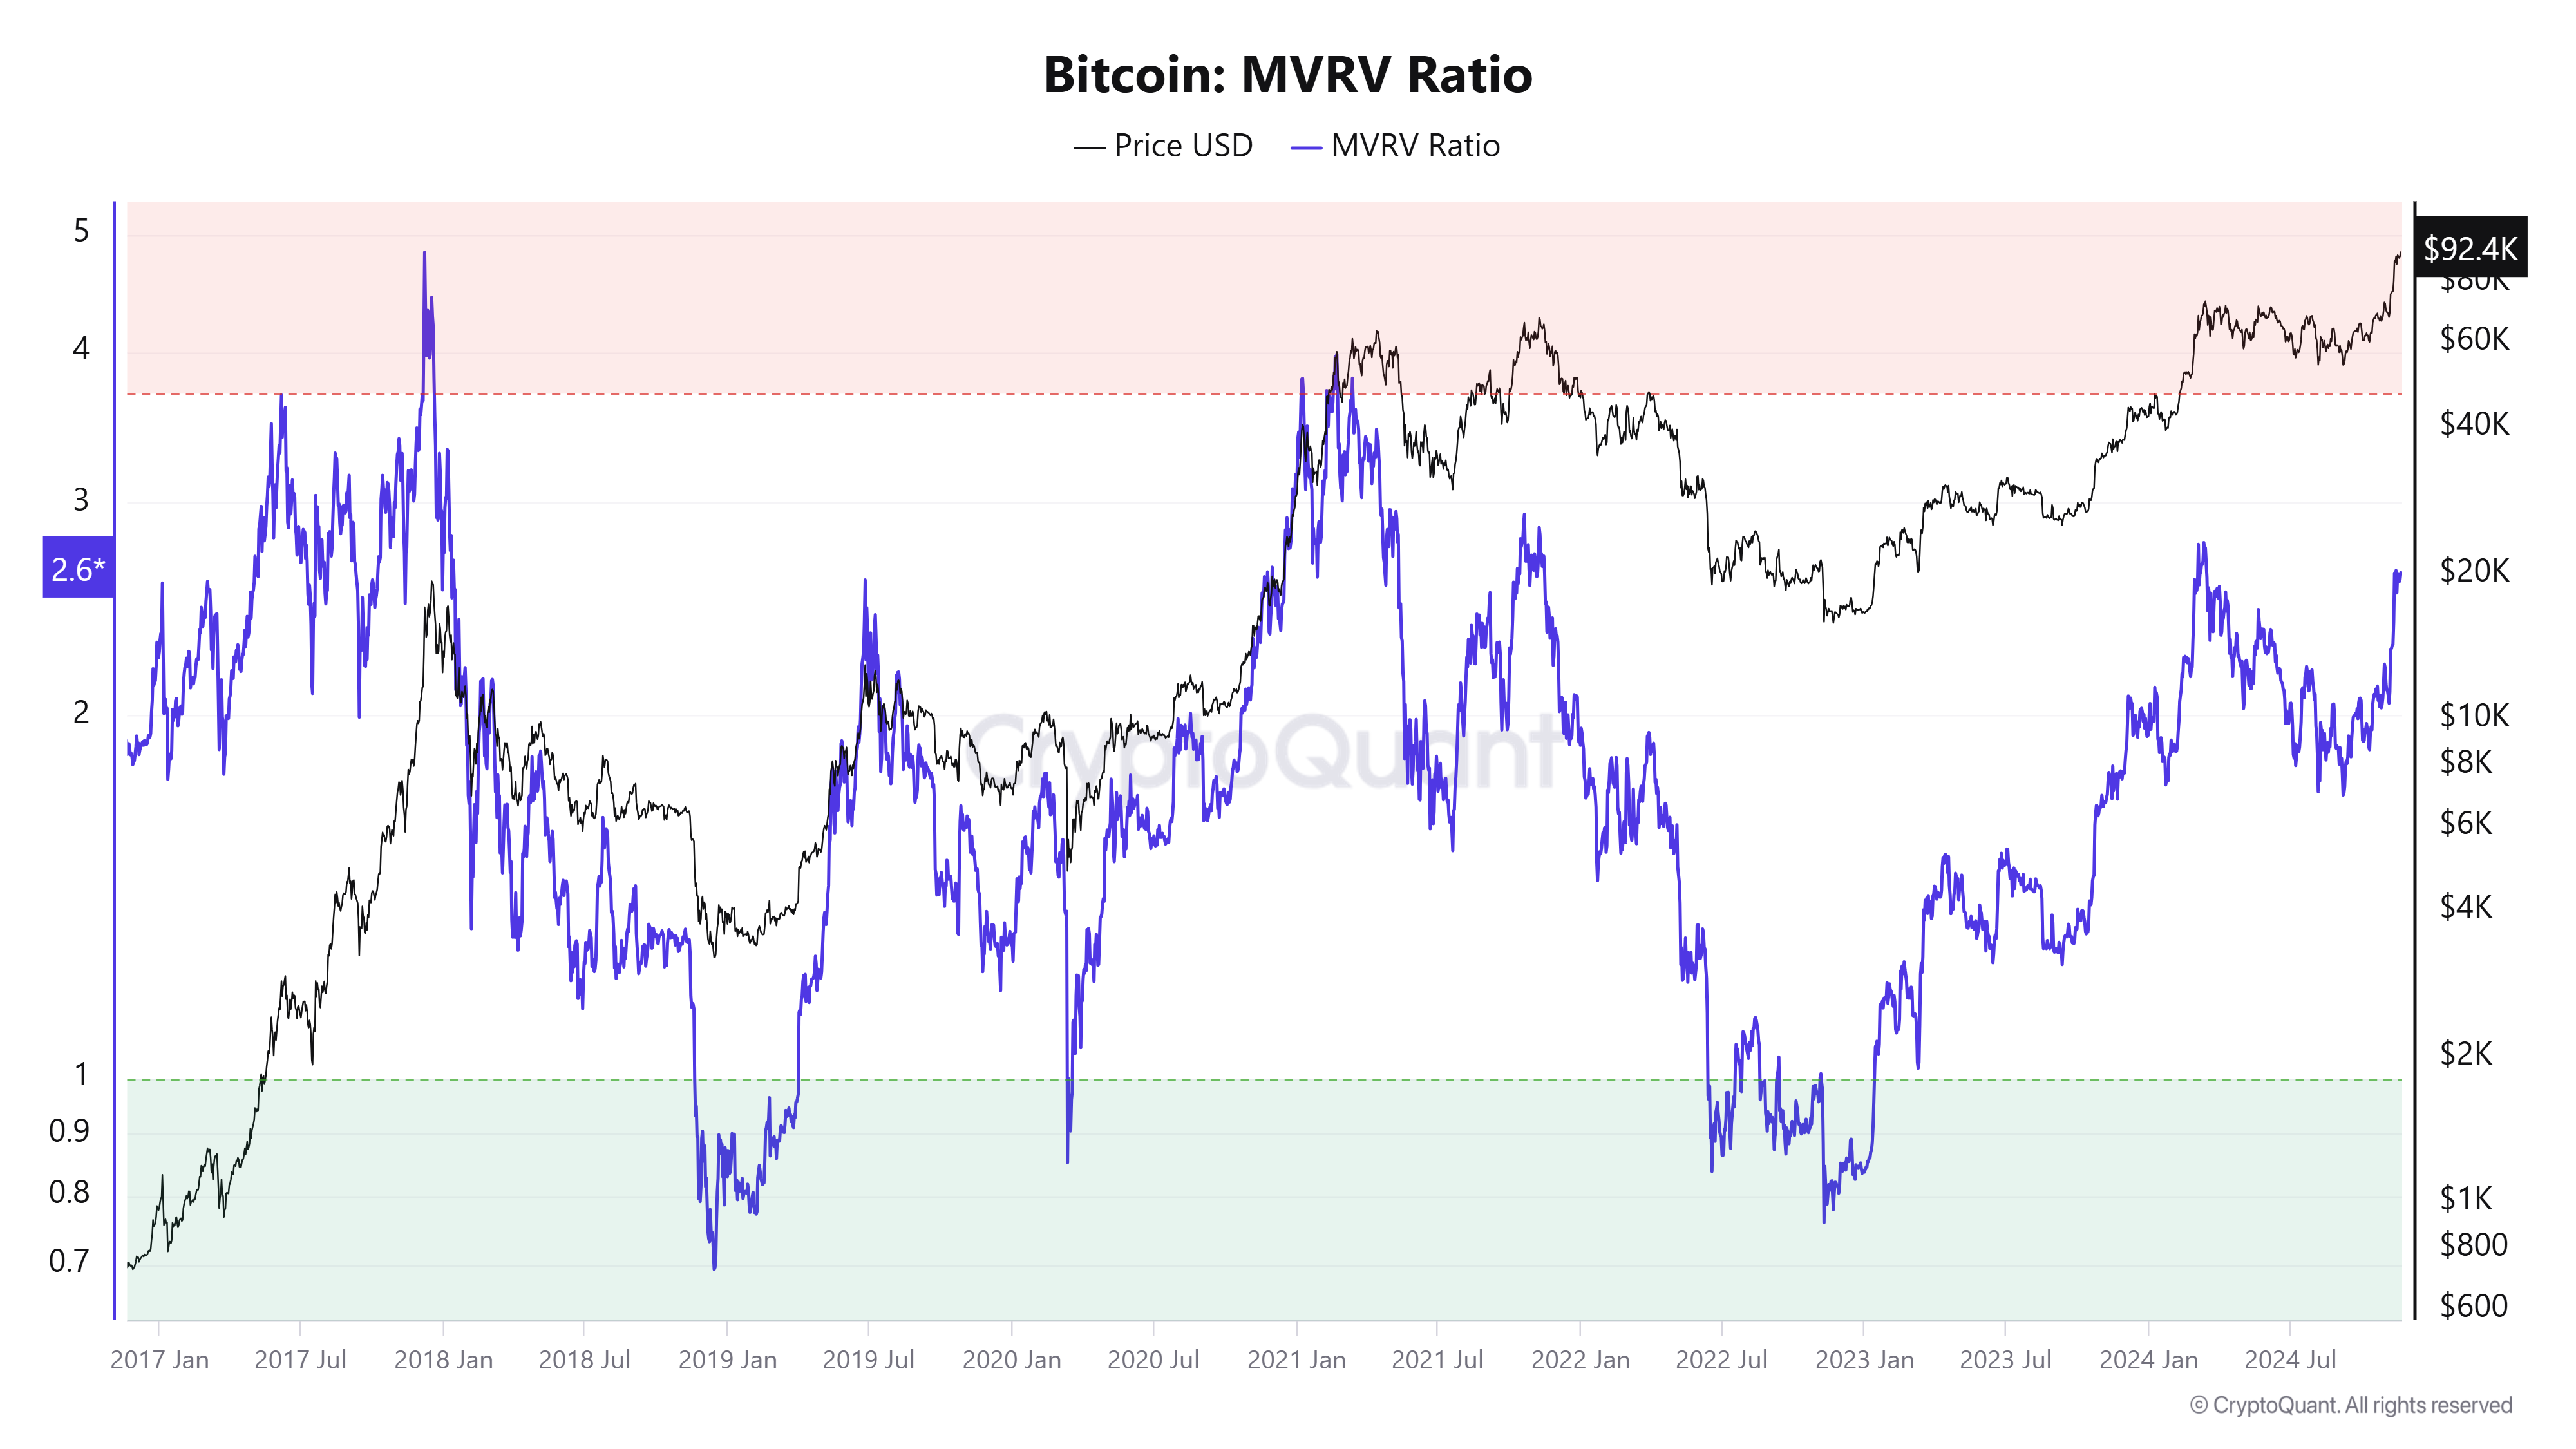
Bitcoin MVRV Ratio chart. Source: CryptoQuant
Additionally, Grayscale will launch Bitcoin ETF options on Wednesday, following BlackRock’s record launch on Tuesday. This could fuel the ongoing rally and create new market dynamics, particularly around options expirations and weekends.
Grayscale is thrilled that Options trading on both $GBTC and $BTC will begin tomorrow – further developing the ecosystem around our US-listed #Bitcoin ETPs. pic.twitter.com/i7kFpOiogq
— Grayscale (@Grayscale) November 19, 2024
Bitcoin Price Forecast: Road to $100K soon
Bitcoin price reached a new all-time high of $94,750 on Wednesday and is currently trading above $94,600. If BTC continues its upward momentum, it could extend the rally to retest the significant psychological level of $100,000.
However, the Relative Strength Index (RSI) momentum indicator stands at 78, hovering above the overbought level of 70, signaling an increasing risk of a correction. Traders should exercise caution when adding to their long positions, as the RSI’s move out of the overbought territory could provide a clear sign of a pullback.

BTC/USDT daily chart.
However, if BTC drops below the $87,000 support level it could extend the decline to nearly $85,000 (November 12 low). A successful close below this level might trigger a deeper sell-off to $78,800 (the 141.4% Fibonacci extension drawn from July’s high of $70,079 to August’s low of $49,000).
Author

Manish Chhetri
FXStreet
Manish Chhetri is a crypto specialist with over four years of experience in the cryptocurrency industry.


