Shiba Inu correction still not over, more pain yet to come for SHIB
- Shiba Inu is awaiting a 7% drop after losing a quarter of its value from its swing high on August 17.
- The risk is skewed to the downside, as a prevailing chart pattern suggests that SHIB still has room to fall.
- Failure to slice above $0.00000738 could spell more trouble for the bulls.

Shiba Inu has presented a clear downtrend since its local top at $0.00000947 on August 17. SHIB has painted a bearish outlook with a governing technical pattern that suggests the canine-themed cryptocurrency still faces the risks of a 7% drop from the current level.
Shiba Inu bulls dog-tired as SHIB continues to retrace
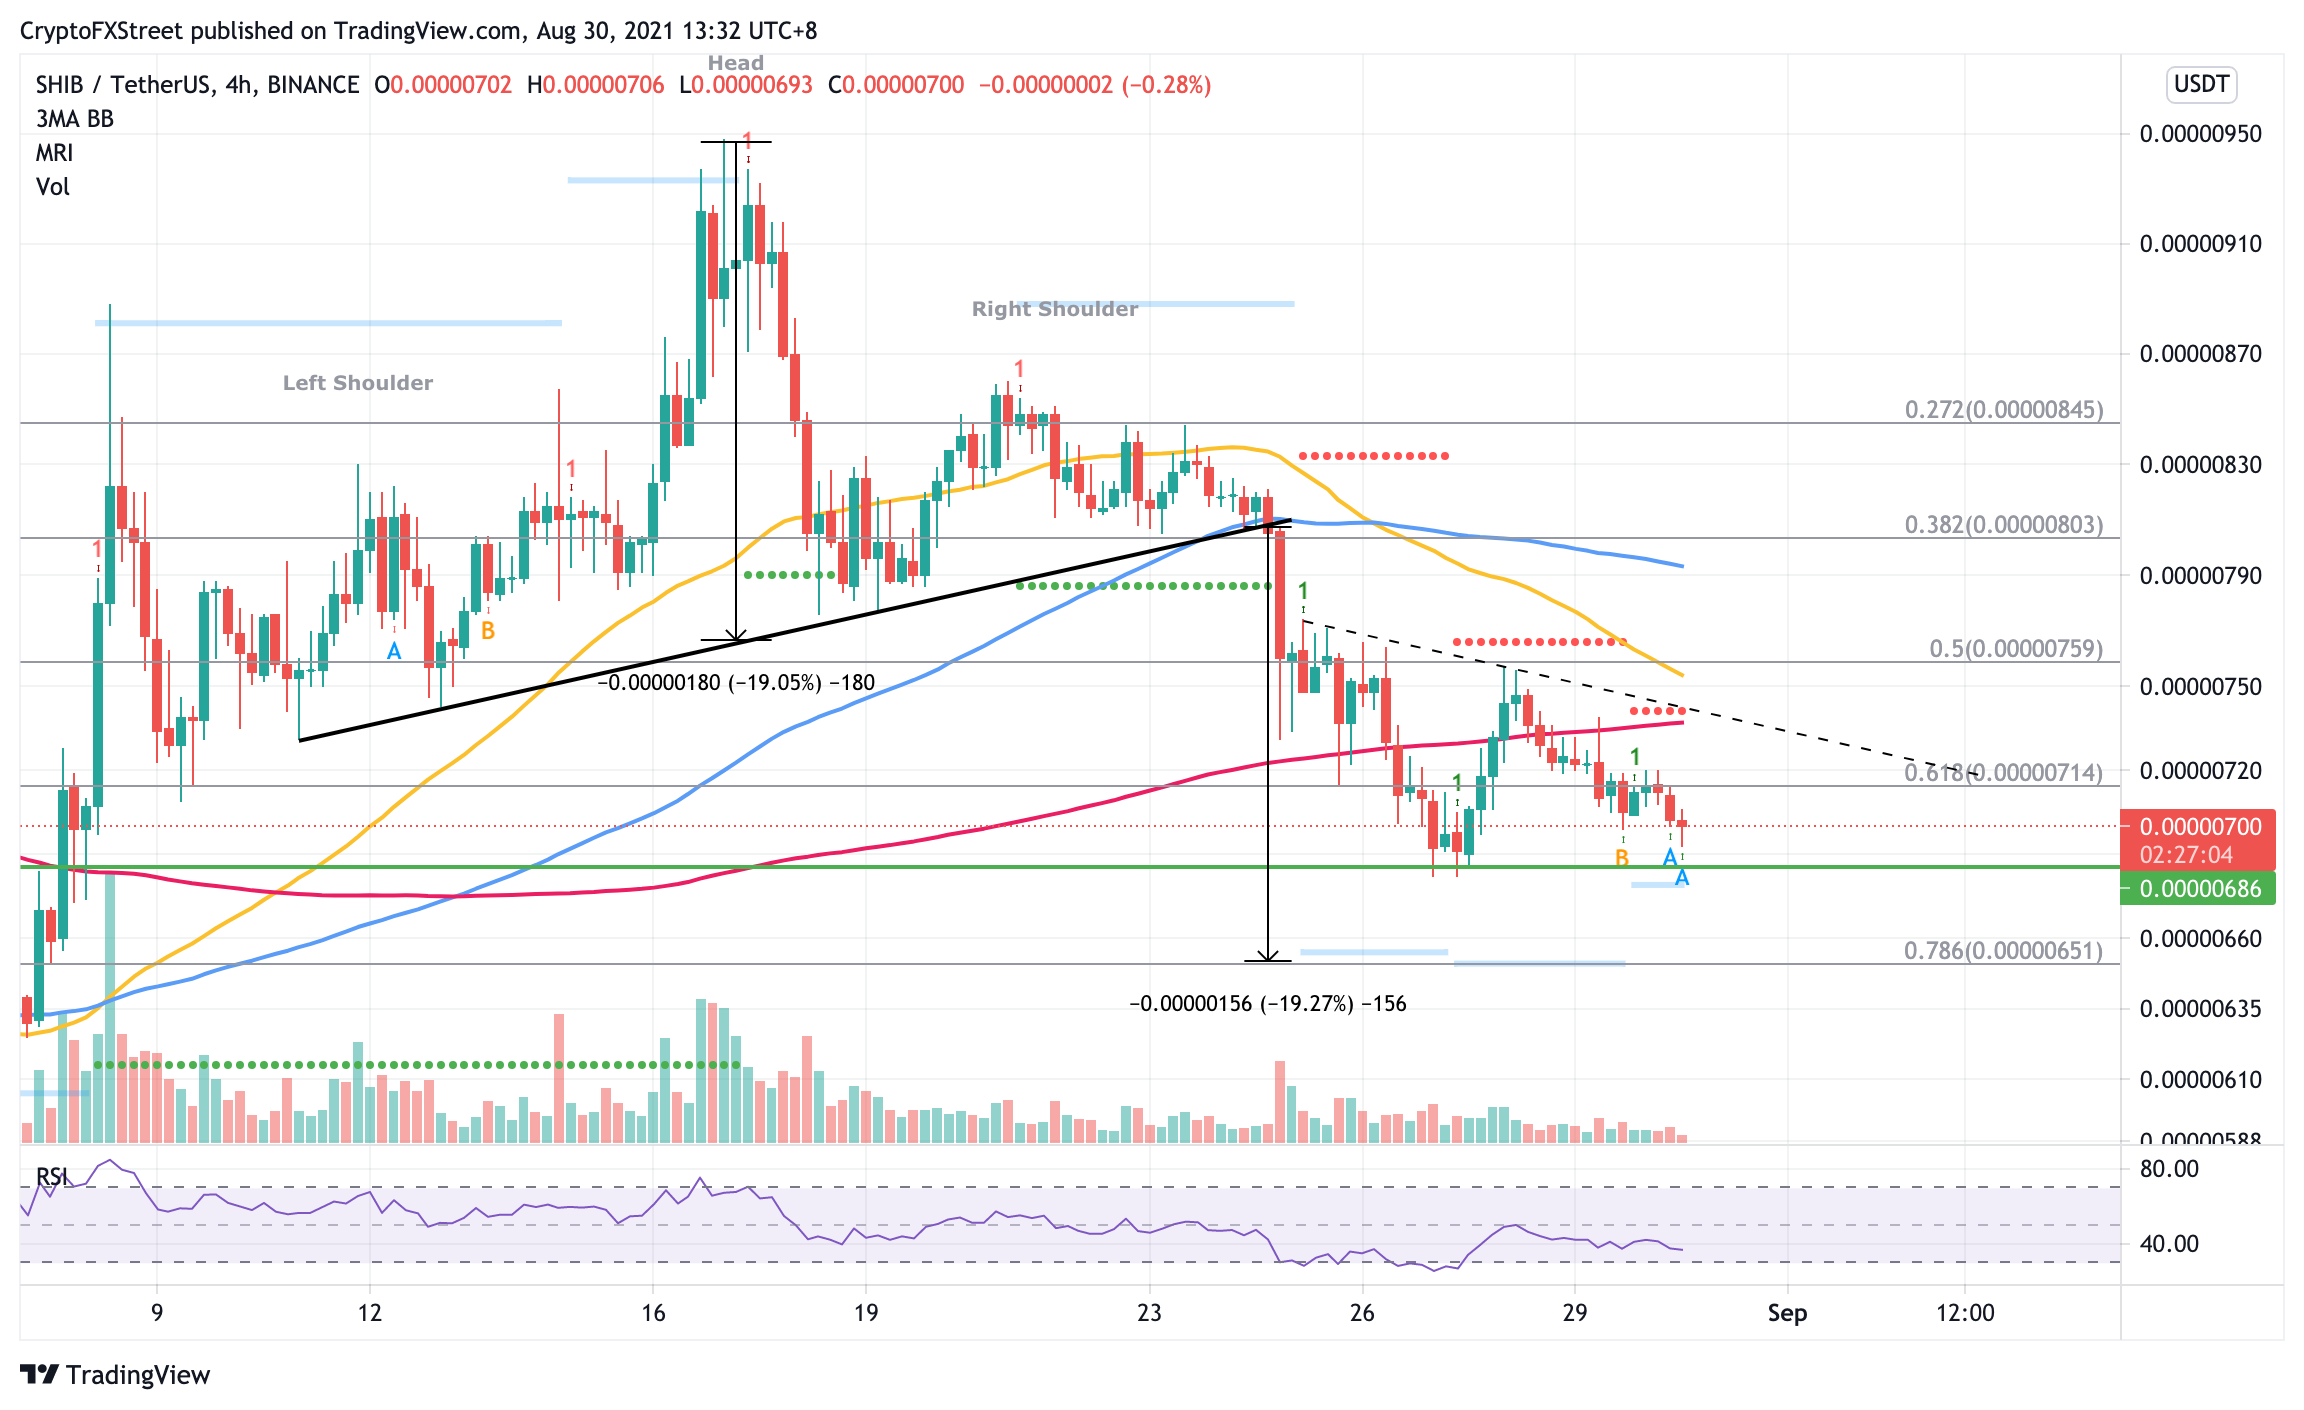
Shiba Inu is on course for a 19% downswing as a head-and-shoulders pattern has emerged on the 4-hour chart.
The governing chart pattern suggests a pessimistic target toward $0.00000651, coinciding with the 78.5% Fibonacci retracement level, as the bulls hand over control to the bears. The momentum is skewed to the downside, as Shiba Inu has already fallen 12% from the neckline of the technical pattern.
However, Shiba Inu price may discover a foothold at $0.00000686 before plunging toward the aforementioned bearish target. Should SHIB fail to sustain above this level, the dog-themed cryptocurrency may eventually reach $0.00000651.
Further, the breakout line given by the Momentum Reversal Indicator (MRI) suggests that Shiba Inu may see the 7% drop materialize if the bears bust through $0.00000680.
SHIB/USDT 4-hour chart
On the flip side, if the bulls manage to shift price action to the upside, Shiba Inu is most likely to face resistance at the 61.8% Fibonacci retracement level at $0.00000714. The following obstacle may arise at the 200 four-hour Simple Moving Average (SMA) at $0.00000738, coinciding with the resistance line defined by the MRI.
Moving forward, Shiba Inu may continue to print lower highs, as the diagonal resistance trend line that meets the 200 four-hour SMA pressures SHIB in a downward direction. Only a break above $0.00000738 could see the token reverse the period of sluggish performance.
An increase in buying pressure may see SHIB reach the 50 four-hour SMA, near the 50% Fibonacci retracement level at $0.00000759. However, higher levels are not expected of Shiba Inu unless purchasing volume ramps up, shifting the power back to the bulls.
Author

Sarah Tran
Independent Analyst
Sarah has closely followed the growth of blockchain technology and its adoption since 2016.