Safemoon Price Prediction: A Stairway to Hell
- Safemoon price declines in stair-step fashion throughout the summer.
- An influx of volume has entered the market during September.
- A breach below $0.0002716 could catalyze a 70% decline.

Safemoon price has been descending in turbulent fashion throughout the summer. A breach of the swing low established in May could catalyze a sharp decline.
Safemoon price shows concern
Safemoon price has been a lagging cryptocurrency throughout the summer. Since the first day of Summer on June 21, the Safemoon price has lost 54% of its market value. Despite the percentage, the decline has not come with ease as the price has stair-stepped its way south, causing erratic and unpredictable pullbacks along the way.
Safemoon price currently auctions at $0.0002950, just above a descending parallel channel which has continued to provide support throughout the decline. This is a very peculiar signal that prompts a reasonable question. What will Safemoon do next?
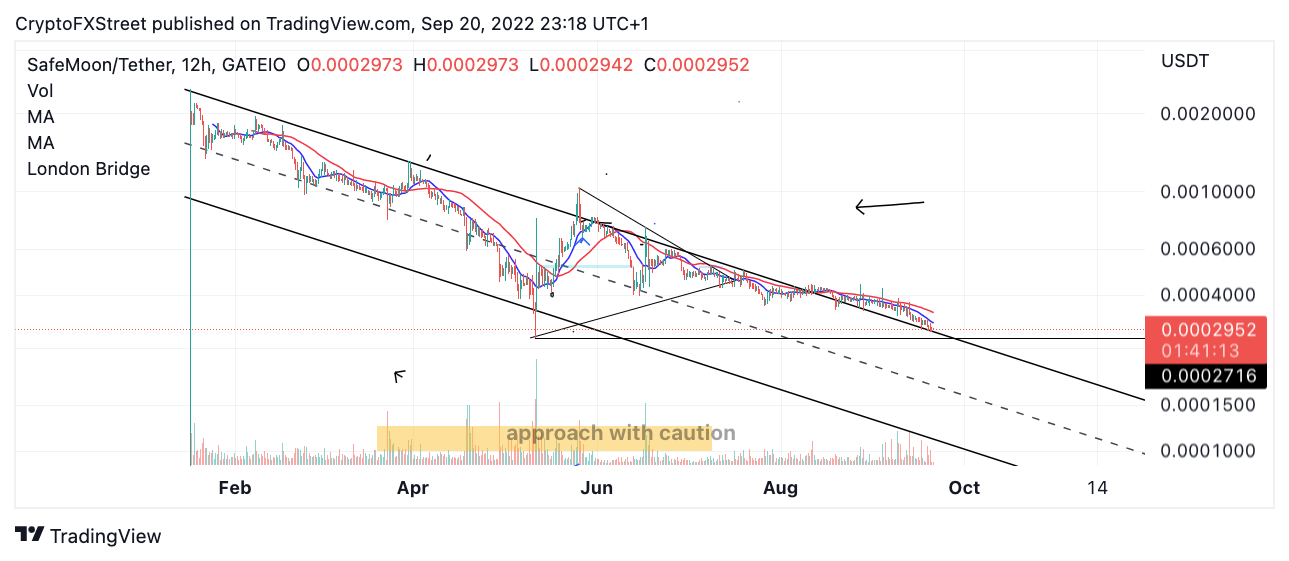
SFM USDT 12-Hour Chart
The Volume Profile Indicator shows an uptick in transactions amidst the decline since September. Furthermore, the bears have lost support from the 8-day exponential moving average this week. Combining these factors, this thesis leans toward a bearish outcome.
The current Safemoon price hovers 8% above a swing low established in May at $0.0002716. The stair-step decline may be enticing bullish traders to take a gamble by placing invalidation of their positions under the low. This thesis argues against doing just that. A breach of the low is likely to occur if market conditions persist. A breach of the springtime swing low could catalyze a 70% drop using a triangle projection method since the swing low is a leg within the triangle.
In the following video, our analysts deep dive into the price action of Safemoon, analyzing key levels of interest in the market. -FXStreet Team
Author

Tony M.
FXStreet Contributor
Tony Montpeirous began investing in cryptocurrencies in 2017. His trading style incorporates Elliot Wave, Auction Market Theory, Fibonacci and price action as the cornerstone of his technical analysis.


