SafeMoon Price Analysis: SAFEMOON drifts lower as enthusiasm vanishes
- SafeMoon price continues to oscillate within a descending channel formation on the four-hour chart.
- Declining 50 four-hour simple moving average (SMA) providing resistance since May 31.
- 40% gain is possible if May’s declining trend line is conquered.

SafeMoon price evolution since May 25 has tested the patience of bullish investors. The rookie digital asset has not commanded sustainable buying pressure, instead staying locked in a descending channel offering brief swing trading opportunities. Until SafeMoon price can free itself from the channel and reignite SAFEMOON enthusiasm, investors should be content with minor double-digit returns.
SafeMoon price weighed down by broader crypto market woes
SAFEMOON was launched on March 21 with a SafeMoon price of $.0000000010, and it reached $0.00001500 on April 20, rewarding the first adopters with an astronomical return. The magnitude and speed of the advance captured headlines, lifting the number of users to over one million.
The market capitalization currently rests at $2.23 billion, ranking it #204 in the cryptocurrency rankings with over 585 trillion tokens in circulation, according to CoinMarketCap. It is relatively inexpensive compared to most digital assets allowing investors to amass positions in the millions of SAFEMOON.
SAFEMOON developers can burn tokens manually with the logic that a smaller supply will drive up the price. In the protocol whitepaper, SAFEMOON state that it “aims to implement a burn strategy that is beneficial and rewarding for those engaged for the long term.”
SAFEMOON is not listed on the major cryptocurrency exchanges, so enthusiastic investors need to access it on the decentralized PancakeSwap exchange.
Currently, SafeMoon price has fallen into a descending channel, replacing the sharp downtrend into the May 23 low. The channel has remained below the declining 50 four-hour SMA, and the volume underpinning the formation has been below average.
A breakout above the channel’s upper boundary at $0.00000476 should ignite a rally to the May 11 declining trend line at $0.00000565 and then the 38.2% retracement of the May correction at $0.00000620.
The 200 four-hour SMA at $0.00000668 will be an epic confrontation, considering that it resisted the rebound attempt from the May 19 low. It would still represent a 40% gain from the channel’s upper boundary as of today.
Ambitious SAFEMOON investors should target the 50% retracement at $0.00000731 and then the 61.8% retracement at $0.00000841, which aligns with considerable price congestion gathered from May 6 to May 18.
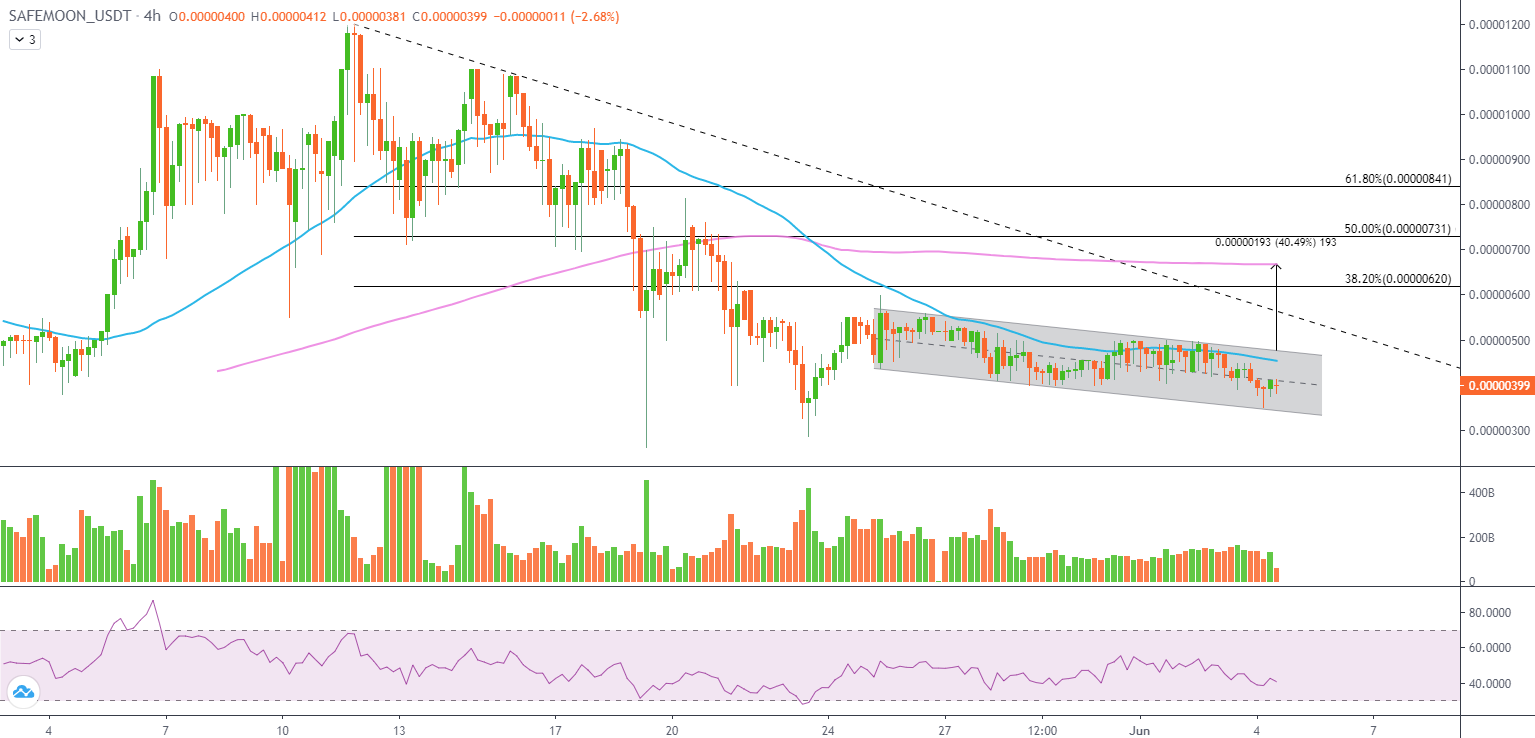
SAFEMOON/USD 4-hour chart
After tagging the all-time high at $0.00001500 on April 20, SafeMoon price collapsed 90% as FOMO exited the building. Based on that experience, investors need to be prepared for the downside.
A four-hour close below the channel’s lower boundary at $0.00000341 would alert investors to anticipate a test of the May 23 low at $0.00000285 and the May 19 low at $0.00000261, leaving a 35% decline for the undisciplined market operators.
SafeMoon price is defining a price history and personality, searching for the next wave of brave investors and hype to transform it into a mainstay digital asset, such as what occurred with DOGE. For now, SAFEMOON will be attached to the trendless conditions of the larger cryptocurrency market until that comes to fruition.
Author

Sheldon McIntyre, CMT
Independent Analyst
Sheldon has 24 years of investment experience holding various positions in companies based in the United States and Chile. His core competencies include BRIC and G-10 equity markets, swing and position trading and technical analysis.


