- Ripple announced the private testing of its stablecoin RLUSD on XRP Ledger and Ethereum.
- RLUSD is awaiting regulatory approval before users can purchase and trade with it.
- XRP is down over 6% following the announcement.
Ripple revealed on Friday that it has begun beta testing for its RLUSD stablecoin, pending regulatory approval for its usage. Meanwhile, XRP has declined over 6% in the past 24 hours but could see a rally after the announcement.
XRP down amid Ripple's move to launch USD stablecoin
Ripple has begun testing its US Dollar-backed Ripple USD (RLUSD) stablecoin on the XRP Ledger and Ethereum Mainnet, according to an announcement on its X handle on Friday. The fintech company plans for the stablecoin to be released to the public following approval from regulatory authorities.
The company claims that RLUSD will be fully backed by the US Dollar and pegged to its price 1:1. The asset will also be backed by short-term US Treasuries and other cash equivalents. Ripple also claims that a third-party accounting firm will audit the reserve assets and provide monthly reports.
Ripple initially announced its intention to launch a stablecoin in April. The company states that the stablecoin will help serve users by bringing high-quality assets to the XRP Ledger.
The new milestone comes days after ending a two-year regulatory brawl with the Securities & Exchange Commission (SEC), which lasted four years, dating back to December 2020. The case was finally resolved on Wednesday after a court ruled a $125 million civil penalty fee as opposed to the SEC's request for a $2 billion fine.
Meanwhile, XRP has declined 6.9% in the past 24 hours to $0.57. Many supporters claim that the stablecoin move, coupled with the end of its SEC regulatory hurdle, will prove a bullish catalyst for XRP.
On the daily charts, XRP could decline to fill the liquidity void around the $0.5 price level. A trendline connecting April 13, June 7, July 13 and August 7 could provide support for XRP to see a bounce if it approaches this level.
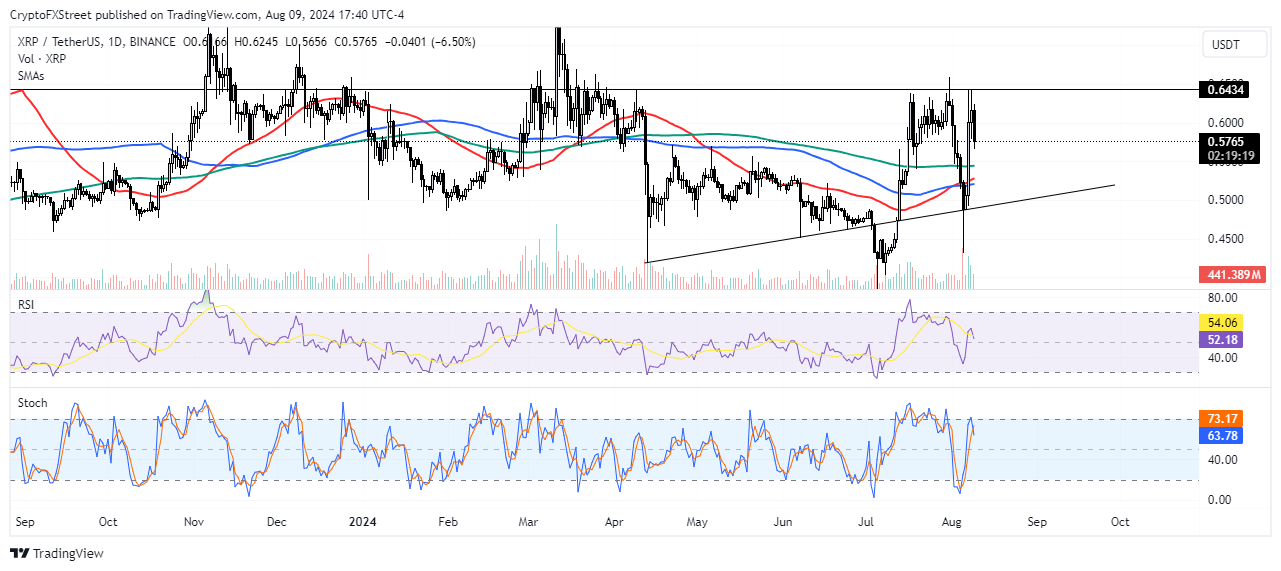
XRP /USDT Daily chart
The thesis is strengthened by the Relative Strength Index (RSI) line moving below the yelllow moving average line and the Stochastic Oscillator %K line crossing below the %D line.
An upward move above $0.64 will invalidate the bearish thesis.
Information on these pages contains forward-looking statements that involve risks and uncertainties. Markets and instruments profiled on this page are for informational purposes only and should not in any way come across as a recommendation to buy or sell in these assets. You should do your own thorough research before making any investment decisions. FXStreet does not in any way guarantee that this information is free from mistakes, errors, or material misstatements. It also does not guarantee that this information is of a timely nature. Investing in Open Markets involves a great deal of risk, including the loss of all or a portion of your investment, as well as emotional distress. All risks, losses and costs associated with investing, including total loss of principal, are your responsibility. The views and opinions expressed in this article are those of the authors and do not necessarily reflect the official policy or position of FXStreet nor its advertisers. The author will not be held responsible for information that is found at the end of links posted on this page.
If not otherwise explicitly mentioned in the body of the article, at the time of writing, the author has no position in any stock mentioned in this article and no business relationship with any company mentioned. The author has not received compensation for writing this article, other than from FXStreet.
FXStreet and the author do not provide personalized recommendations. The author makes no representations as to the accuracy, completeness, or suitability of this information. FXStreet and the author will not be liable for any errors, omissions or any losses, injuries or damages arising from this information and its display or use. Errors and omissions excepted.
The author and FXStreet are not registered investment advisors and nothing in this article is intended to be investment advice.
Recommended Content
Editors’ Picks

Crypto Today: BTC, ETH, and XRP lead $1.4B capitulation on Black Monday as FTX denies $2.5B claims
Cryptocurrencies nosedived over the weekend, shedding over $300 billion since Friday. What some traders on social media are terming crypto’s Black Monday, losses come after an initial positive decoupling on Thursday, when US stocks crashed after China announced 34% retaliatory tariffs.

Bitcoin hits new yearly low below $75,000 as global trade war escalates
Bitcoin price extends its fall by 4% on Monday after correcting near 5% the previous week. The global trade war escalated, wiping out 452,976 leveraged traders and causing a total liquidation of $1.39 billion from crypto markets in the last 24 hours.

Dogecoin shatters $0.15 support as ‘Black Monday’ bloodbath fears surge
Dogecoin tumbles over 10% on Monday, slashing $3.73 billion from its market capitalization to $19.78 billion. CNBC host Jim Crammer warns of global markets’ bloodbath if US President Donald Trump stays intrasigent.

Solana Price Forecast: Bears gain momentum as SOL falls below $100
Solana (SOL) extends its loss by over 7% and falls below the $100 mark at the time of writing on Monday after crashing 15.15% last week. Coinglass data shows that SOL’s leveraged traders wiped out nearly $70 million in liquidations in the last 24 hours.

Bitcoin Weekly Forecast: Tariff ‘Liberation Day’ sparks liquidation in crypto market
Bitcoin (BTC) price remains under selling pressure and trades near $84,000 when writing on Friday after a rejection from a key resistance level earlier this week.

The Best brokers to trade EUR/USD
SPONSORED Discover the top brokers for trading EUR/USD in 2025. Our list features brokers with competitive spreads, fast execution, and powerful platforms. Whether you're a beginner or an expert, find the right partner to navigate the dynamic Forex market.