Top 3 Price Prediction Bitcoin, Ethereum, Ripple: Bitcoin could decline following retest of key resistance level
- Bitcoin's price retests the key resistance zone at $62,066, and rejection may continue to drive its downtrend.
- Ethereum's price experiences a brief rise before a potential downtrend continues.
- Ripple's price retests its daily resistance level at $0.643; failure to close above this level could result in a price decline.

Bitcoin (BTC), Ethereum (ETH), and Ripple (XRP) each saw modest recoveries with brief upward movements on Thursday. Still, these gains seem temporary, as technical analysis and market conditions indicate that the overall downward trends for these cryptocurrencies are expected to resume in the coming days.
Bitcoin price poised for a decline after rejection at key resistance level
Bitcoin price retested its 61.8% Fibonacci retracement level at $62,066 (drawn from the swing high of $70,079 on July 29 to Monday's low of $49,101) on Thursday. As of Friday, it trades slightly lower by 0.6% at $61,380.
If BTC faces rejection at the $62,066 level, which also coincides with the broken trendline and the 100-day Exponential Moving Average (EMA) at around $63,021, it will be a critical zone to watch.
Failure to break above $62,066 might trigger a 19% crash, back to retest the $49,917 daily support level.
The Relative Strength Index (RSI) indicator in the daily chart faces resistance around the neutral level of 50, and the Awesome Oscillator (AO) is still below its neutral level of zero. However, they are comfortably below their respective neutral levels of 50 and zero. These momentum indicators strongly indicate bearish dominance.
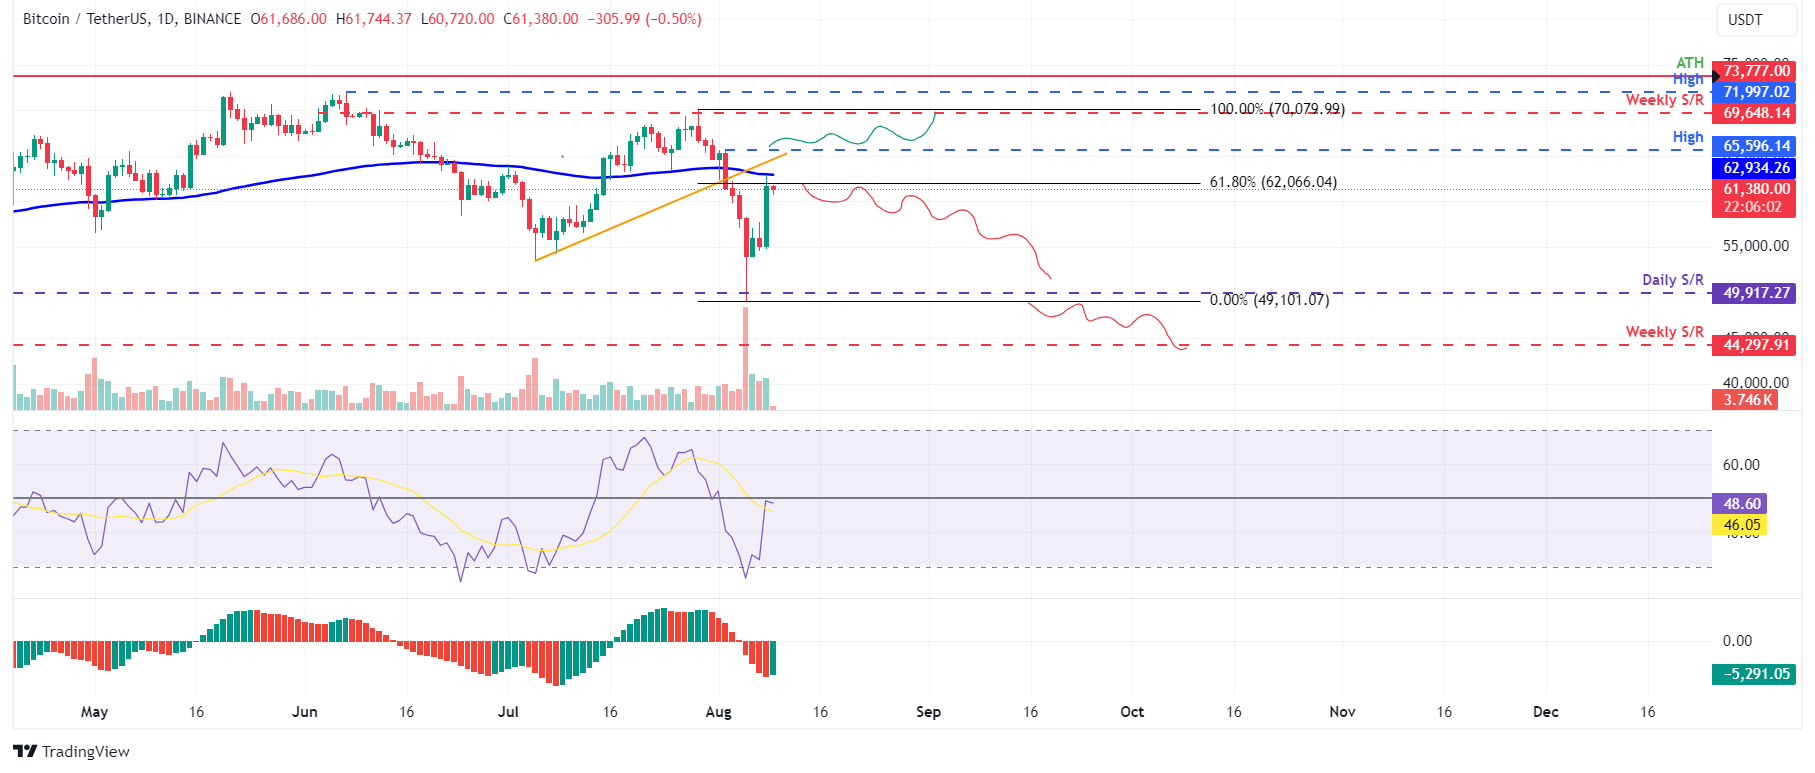
BTC/USDT daily chart
On the other hand, If BTC closes above the August 2 high of $65,596, it would change the market structure by forming a higher high on the daily timeframe. Such a scenario might drive a 6% rise in Bitcoin's price to retest its weekly resistance at $69,648
Ethereum price vulnerable to decline after hitting key resistance barrier
Ethereum price closed below the daily support level of $2,927 on August 3, dropping 16.5% over the next two days. However, after testing the weekly support at $2,118, it rebounded with a 10.68% increase from Tuesday to Thursday. As of Friday, it is trading slightly lower at $2,668, down 0.3%.
If ETH continues to recover, it may encounter resistance around the 50% retracement level at $2,843 (drawn from the swing high of $3,562 on July 22 and Monday's low of $2,124). This level closely aligns with the daily resistance at $2,927, making it a crucial area to monitor for potential reversal.
If Ethereum's price fails to surpass the $2,843 level, it could decline 25% to retest its weekly support at $2,118.
The daily chart's RSI and the AO have fallen below their neutral levels of 50 and zero, respectively, indicating an overarching bearish trend based on these momentum indicators.
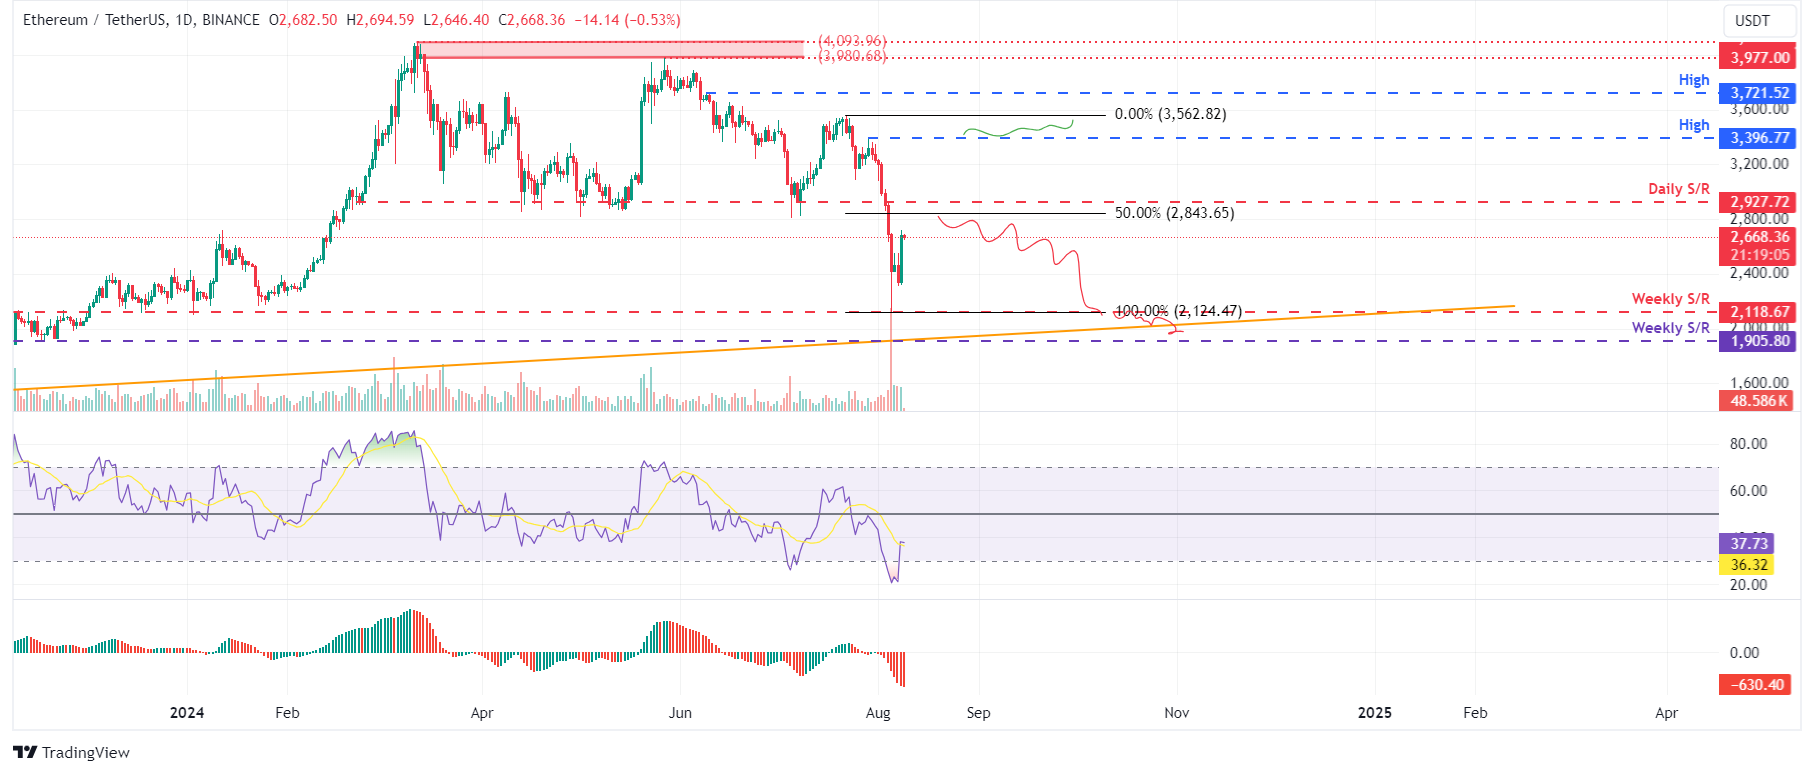
ETH/USDT daily chart
However, if Ethereum price closes above the $3,396 daily high from July 29, it would create a higher high on the daily timeframe, potentially leading to a 5% increase as it retests the July 22 high of $3,562.
Ripple price poised for a fall as key resistance level holds firm
Ripple price retested its daily resistance level at $0.643 on Wednesday and faced multiple rejections at this level. As of Friday, it trades slightly lower by 0.2% at $0.616.
If the $0.643 level holds as resistance, XRP could crash 15% to revisit its next daily support at $0.544.
The daily chart's RSI and AO have recently crossed their neutral levels of 50 and zero, respectively. However, for bears to gain control, both momentum indicators need to fall below their neutral levels, which would strengthen the bearish trend.
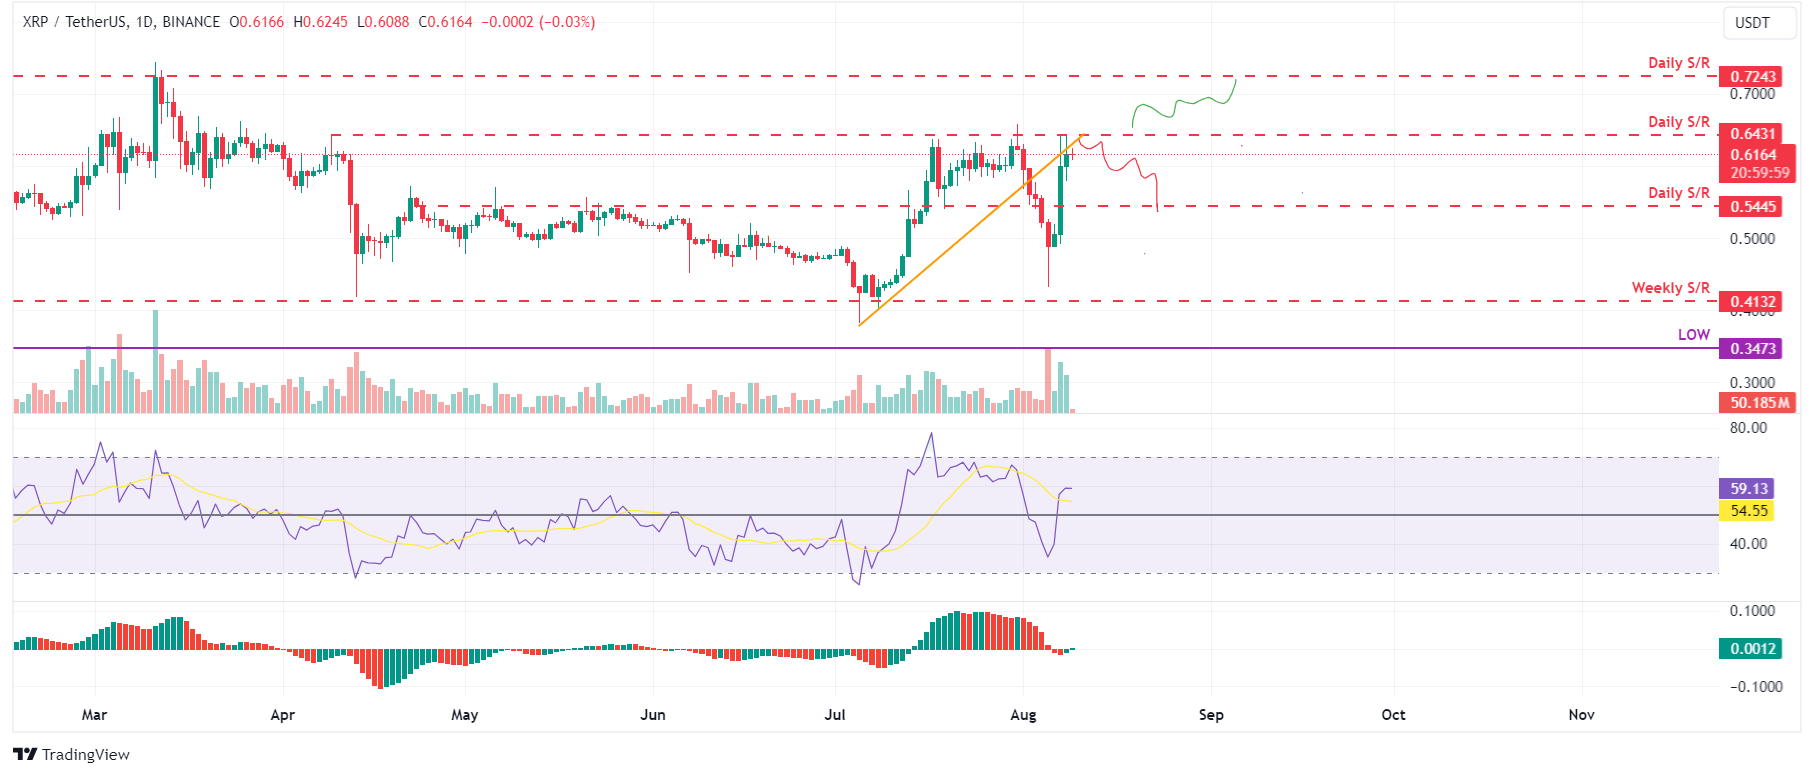
XRP/USDT daily chart
Conversely, if Ripple's price closes above the $0.643 daily resistance level, it would change the market structure by forming a higher high on the daily chart, potentially driving a 12% increase toward the next daily resistance level at $0.724.
Author

Manish Chhetri
FXStreet
Manish Chhetri is a crypto specialist with over four years of experience in the cryptocurrency industry.


