|

Ripple Price Analysis: XRP bulls prepare for a bumpy road, $0.47 be the key hurdle

  • XRP/USD wavers around intraday high inside a bearish chart pattern.
  • Momentum indicator suggests further recovery from three-week-old support.
  • 61.8% Fibonacci retracement, channel’s resistance line will test buyers before 200-bar SMA.
  • One-month-long ascending trend line adds to the support.

XRP/USD eases from an intraday high of $0.4258 to currently around 0.4216 during early Monday. Even so, the altcoin keeps the bounce off short-term horizontal support while flashing 1.5% gains on a day.

With the Momentum indicator favoring the recovery moves, Ripple buyers are up for confronting 61.8% Fibonacci retracement of its January 27 to February 01 upside, at $0.4400.

However, the quote’s upside past-$0.4400 will be questioned by the upper line of the one-week-old falling channel and 200-bar SMA, respectively near $0.4525 and $0.4655.

Although XRP/USD upside past-$0.4655 becomes doubtful, a sustained run-up will not hesitate to challenge the $0.5000 and one-month-old resistance line around $0.6150.

On the flip side, the stated horizontal support of $0.3950 precedes the support line of the immediate channel, near 0.3810, to restrict the altcoin’s immediate downside.

Also acting as the downside filter is an ascending trend line from February 02, currently around $0.3700.

To sum up, XRP/USD is ready for a corrective pullback but the bulls are less likely to be pleased.

XRP/USD four-hour chart
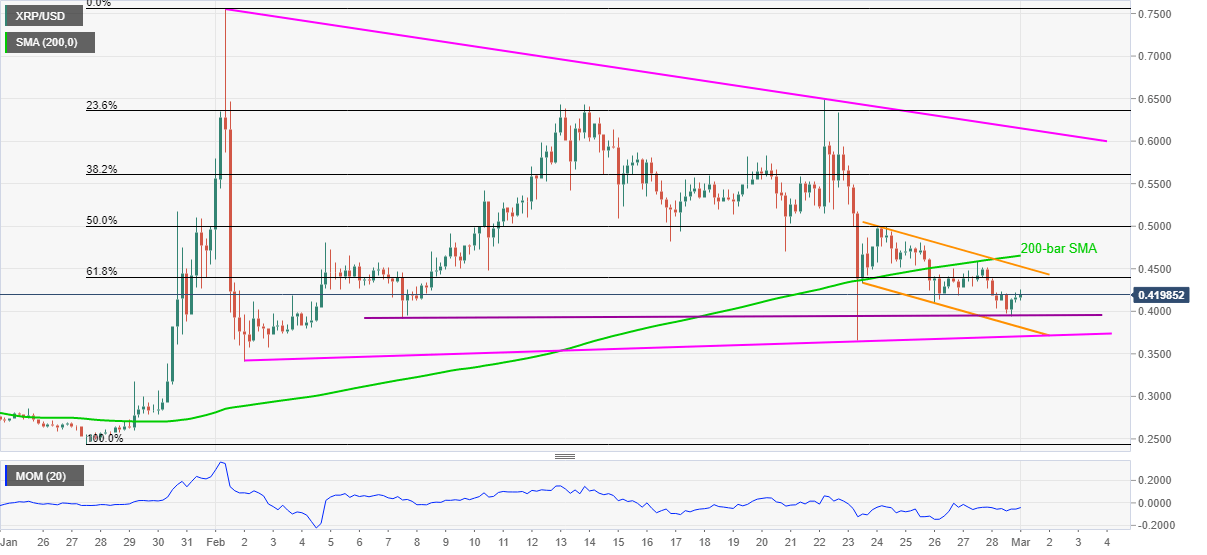
Trend: Further recovery expected

Additional important levels

Overview
Today last price0.4225
Today Daily Change62 pips
Today Daily Change %1.49%
Today daily open0.4163
 
Trends
Daily SMA200.5166
Daily SMA500.4052
Daily SMA1000.4318
Daily SMA2000.3449
 
Levels
Previous Daily High0.439
Previous Daily Low0.3934
Previous Weekly High0.6494
Previous Weekly Low0.3658
Previous Monthly High0.7565
Previous Monthly Low0.3406
Daily Fibonacci 38.2%0.4108
Daily Fibonacci 61.8%0.4216
Daily Pivot Point S10.3934
Daily Pivot Point S20.3706
Daily Pivot Point S30.3478
Daily Pivot Point R10.439
Daily Pivot Point R20.4618
Daily Pivot Point R30.4847

Author

Anil Panchal

Anil Panchal

FXStreet

Anil Panchal has nearly 15 years of experience in tracking financial markets. With a keen interest in macroeconomics, Anil aptly tracks global news/updates and stays well-informed about the global financial moves and their implications.

More from Anil Panchal
Share:

Editor's Picks

Bitcoin Weekly Forecast: BTC retreats as macro headwinds grow
Bitcoin (BTC) remains under pressure, down over 4% this week and trading around $76,900 at the time of writing on Friday. Institutional demand shows signs of weakness as spot BTC Exchange Traded Funds (ETFs) are on track to end their three-week inflow streak, recording nearly $500 million in net outflows through Thursday.
XRP falls toward key support as macro uncertainty, weak momentum cap recovery
Ripple (XRP) falls below $1.33 on Friday, marking the third consecutive day of declines. The token continues to track the broader cryptocurrency market downturn, with investors closely monitoring heightened macroeconomic uncertainty ahead of the United States (US) Consumer Price Index (CPI) release and next week’s Federal Reserve (Fed) monetary policy decision.
Crypto Today: Bitcoin, Ethereum, XRP stabilize at lower levels amid ETF outflows and macroeconomic risks
The broader cryptocurrency market is rising on Friday, with Bitcoin (BTC) trading above $77,000 after testing lower support near $76,500. Ethereum (ETH) shows signs of stability, hovering above the support provided at $2,400 despite capped upside at $2,500. Meanwhile, Ripple (XRP) holds above $1.33 after three straight days of declines, reflecting growing headwinds due to macroeconomic uncertainty.
Bitcoin pulls back as another golden cross fails to deliver
Earlier this week, Bitcoin formed a golden cross, a technical signal that occurs when the price’s 50-day moving average rises above the 200-day moving average and is conventionally viewed as a precursor to a bullish rally. Historically, however, that’s often not been the case.
Bitcoin: BTC retreats as macro headwinds grow
Bitcoin (BTC) remains under pressure, down over 4% this week and trading around $76,900 at the time of writing on Friday. Institutional demand shows signs of weakness as spot BTC Exchange Traded Funds (ETFs) are on track to end their three-week inflow streak, recording nearly $500 million in net outflows through Thursday.

