- Render price is planning to escape its $3.36 to $5.27 range after the recent uptick.
- RNDR is likely to revisit the range’s midpoint at $4.32 or the imbalance, extending from $4.24 to $4.19.
- NVIDIA Corp’s earnings on February 21 could drive the AI-related token to retest the range high of $5.27.
- If RNDR flips the $4.32 support into a resistance level, it will invalidate the bullish thesis.
Render (RNDR) price managed to end its consolidation and trigger a rally that flipped a key resistance level into a support level. This development has now opened the gates for RNDR bulls to take control. Additionally, the NVIDIA Corp’s earnings are set to be announced on February 21, which could affect the AI-related tokens like it did in November 2023.
RNDR’s market value inflated by 68%, a week ahead of the NVIDIA Copr’s earnings on November 21, 2023. So, if history repeats, investors can expect the Render price to restart a similar uptrend.
Also read: Render price trades within a supply zone, risks a 20% fall unless this happens
Render price eyes a range high retest
Render price created the $3.36 to $5.27 range between December 26, 2023 and January 7, 2024. For most of this rangebound movement, RNDR remained below the range's midpoint. The recent burst in buying pressure pushed it to overcome the range’s midpoint at $3.27 and flip it into a support floor.
Now, Render price trades around $4.76, eyeing a retest of the range high at $5.27. There are two outlooks on how this move could play out.
RNDR moves from the current position to retest the range high due to NVIDIA Corp’s earnings in February.
RNDR retraces into the four-hour imbalance, extending from $4.24 to $4.19 before it kickstarts a move to retest range high.
If NVIDIA Corp’s earnings beat expectations by a huge magnitude, then investors can expect the Render price to extend beyond the range high of $5.27 and tag the 161.8% Fibonacci extension level at $6.45.
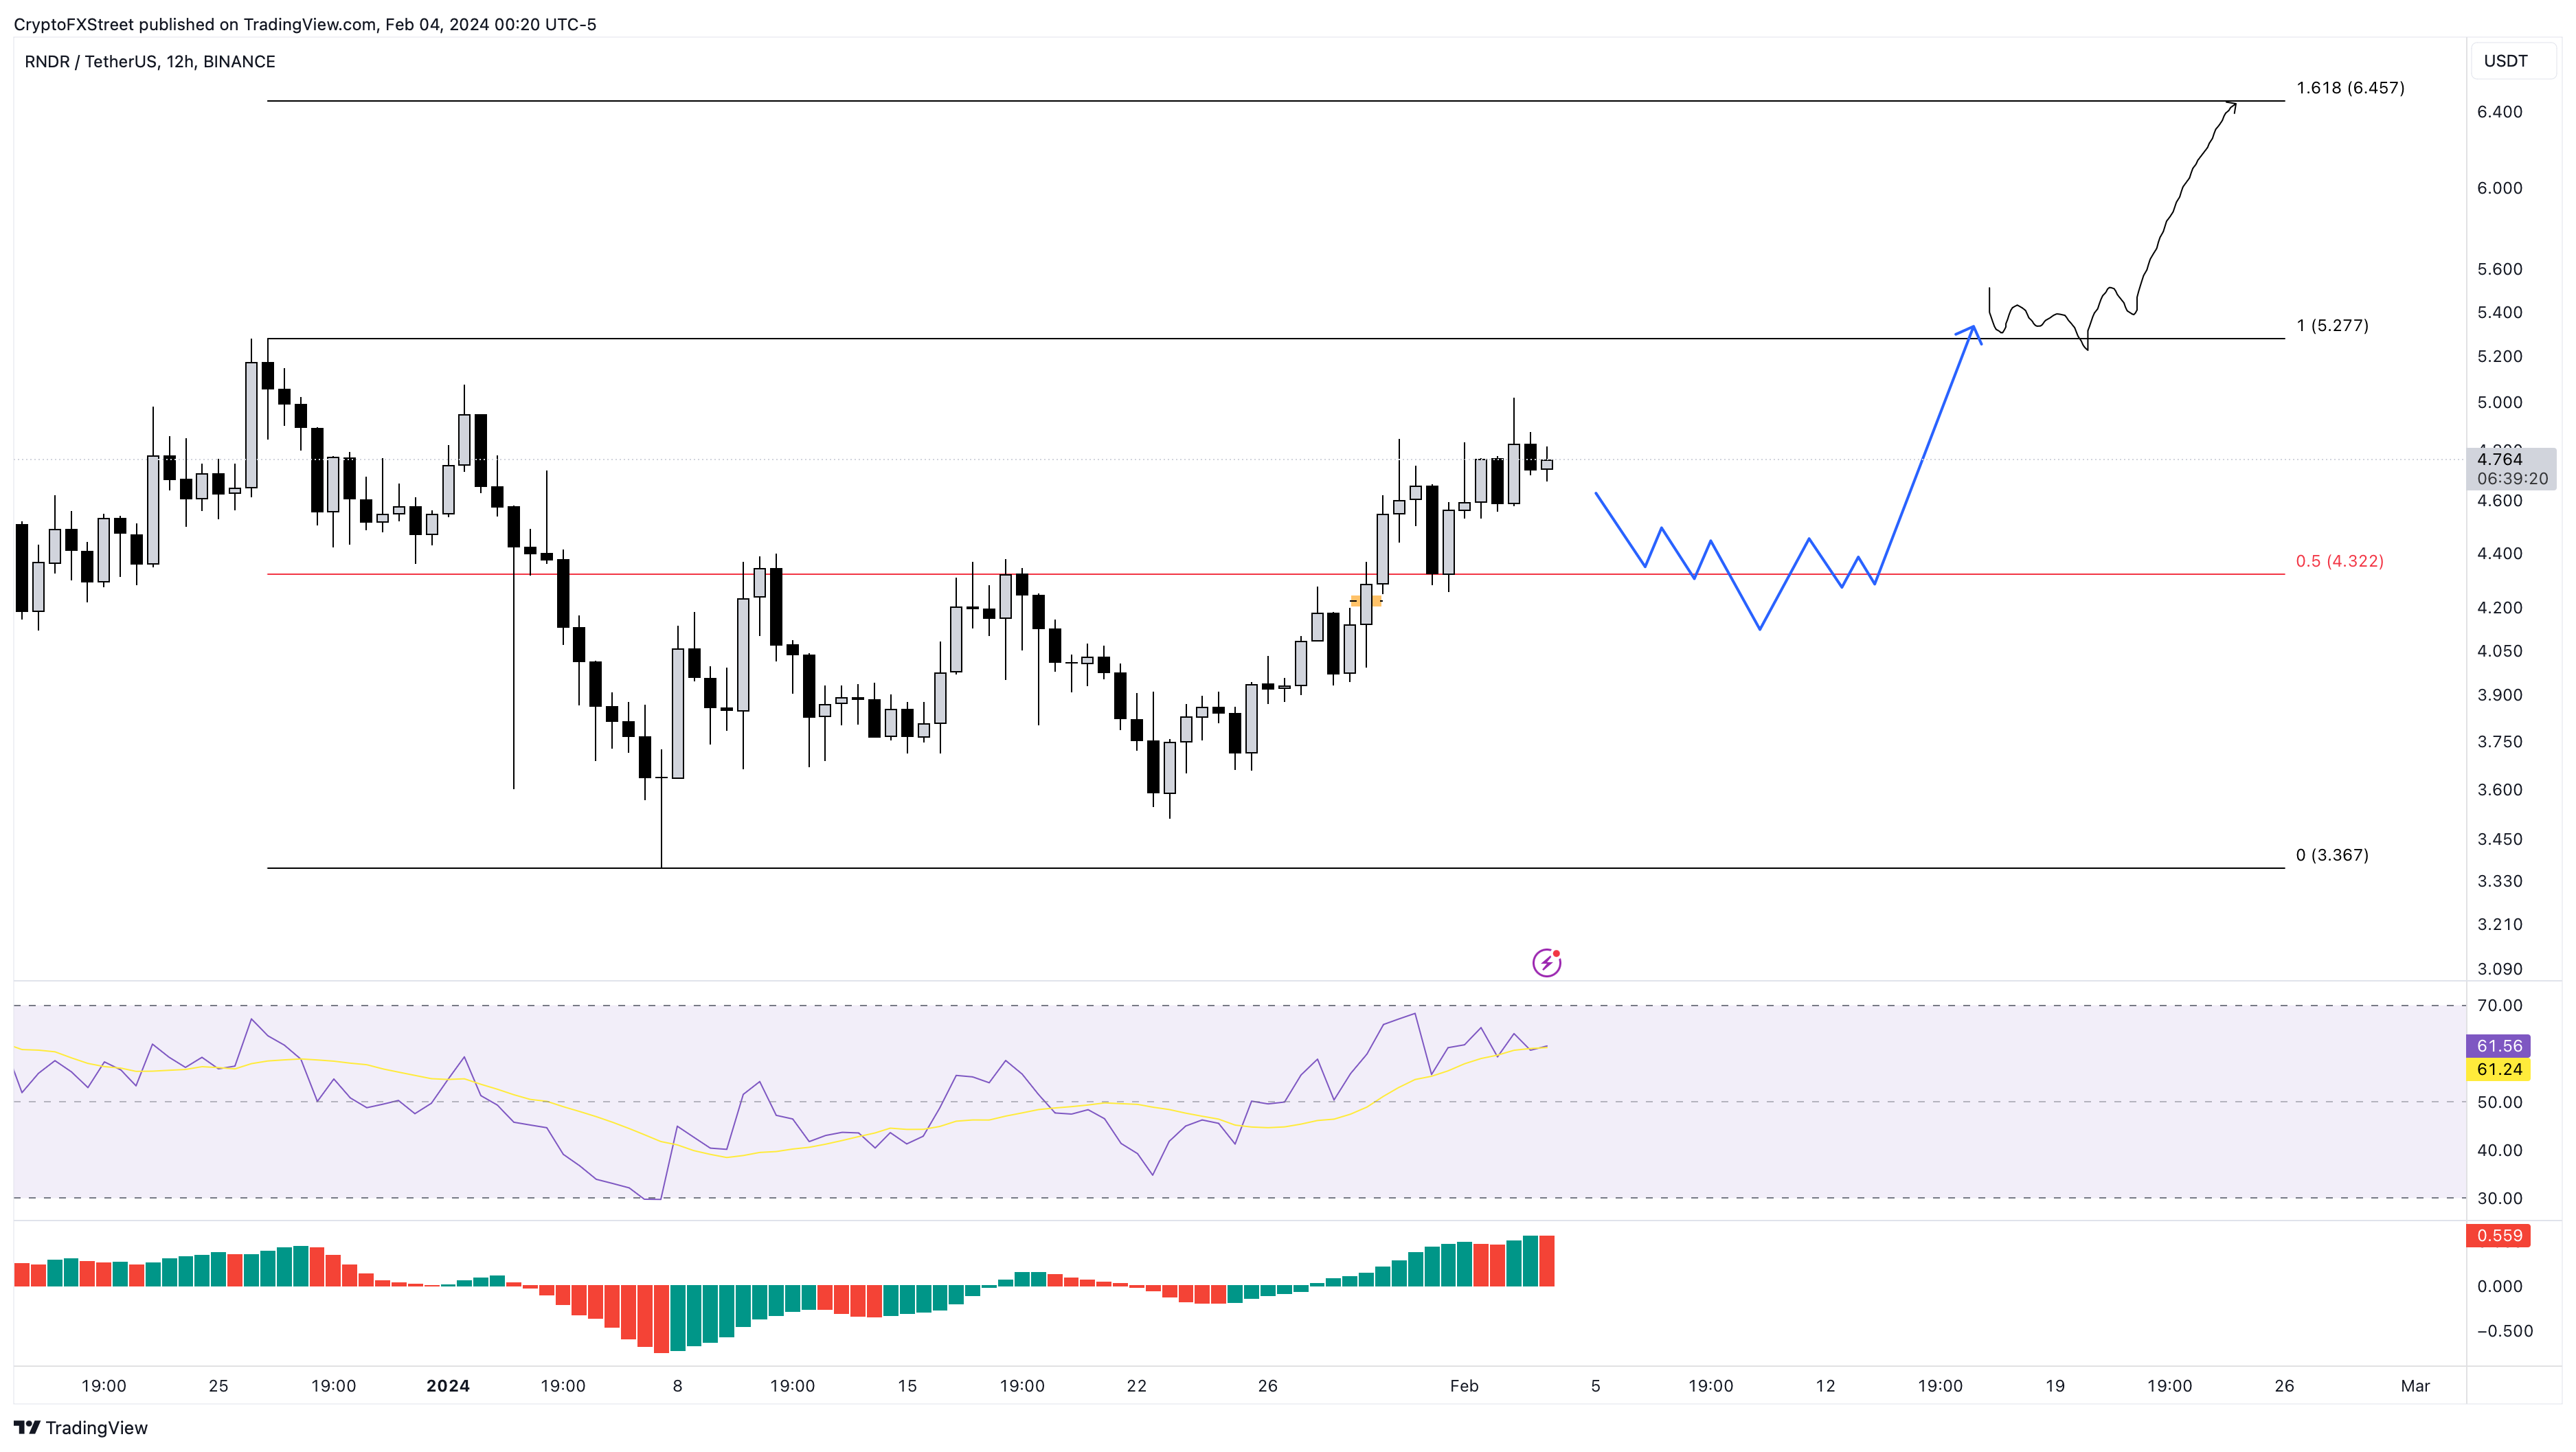
RNDR/USDT 12-hour chart
In the short-term, the optimistic outlook for the Render price is dependent on the recent flip of the range’s midpoint at $4.32. However, a breakdown of this level will invalidate the bullish thesis and potentially trigger a 22% correction to retest or sweep the range low at $3.36. In this case, RNDR could slide nearly 11% and tag the $3 psychological level.
Also read: Render price skyrockets by 25% as Binance announces RNDR listing on its Japanese exchange
(This story was corrected on February 4 at 10:58 AM GMT to say that the RNDR remained below the range's midpoint instead of RNDR remained below the range low.)
Information on these pages contains forward-looking statements that involve risks and uncertainties. Markets and instruments profiled on this page are for informational purposes only and should not in any way come across as a recommendation to buy or sell in these assets. You should do your own thorough research before making any investment decisions. FXStreet does not in any way guarantee that this information is free from mistakes, errors, or material misstatements. It also does not guarantee that this information is of a timely nature. Investing in Open Markets involves a great deal of risk, including the loss of all or a portion of your investment, as well as emotional distress. All risks, losses and costs associated with investing, including total loss of principal, are your responsibility. The views and opinions expressed in this article are those of the authors and do not necessarily reflect the official policy or position of FXStreet nor its advertisers. The author will not be held responsible for information that is found at the end of links posted on this page.
If not otherwise explicitly mentioned in the body of the article, at the time of writing, the author has no position in any stock mentioned in this article and no business relationship with any company mentioned. The author has not received compensation for writing this article, other than from FXStreet.
FXStreet and the author do not provide personalized recommendations. The author makes no representations as to the accuracy, completeness, or suitability of this information. FXStreet and the author will not be liable for any errors, omissions or any losses, injuries or damages arising from this information and its display or use. Errors and omissions excepted.
The author and FXStreet are not registered investment advisors and nothing in this article is intended to be investment advice.
Recommended Content
Editors’ Picks

Bitcoin recovers above $98,000 as Eric Trump encourages WLFI to add BTC
Bitcoin price recovers slightly, trading above $98,000 at the time of writing on Thursday after losing nearly 5% in the last two days. Eric Trump encouraged the addition of BTC to their family-backed crypto platform WLFI portfolio, which may be supporting Bitcoin’s recovery.

Bonk Price Forecast: 2.02 trillion BONK coins will be burn
Bonk price recovers slightly on Thursday after falling over 5% so far this week. BONK announces it will burn 2.02 trillion tokens to celebrate the BONKdragon event and the 2025 Lunar New Year.

Can XRP bounce back? SEC actions may favor Ripple in ongoing appeal
XRP is down 3% in the early hours of Thursday as crypto community members anticipate that the Securities and Exchange Commission's (SEC) appeal of the ruling in its case with Ripple will likely not stand following latest developments under the new administration.

Dogecoin price flashes death cross signal as Elon Musk grills US Treasury
Dogecoin price stabilized around the $0.26 level on Wednesday amid a 22% weekly decline as crypto markets tumbled further. Elon Musk’s latest ‘DOGE’ tweets amid an ongoing face-off with the US Treasury have sparked testy market reactions.

Bitcoin: BTC in positive tone ahead of third highest-returning month
Bitcoin (BTC) price hovers around $104,000 on Friday after bouncing off its 50-day Exponential Moving Average earlier this week. A K33 Research explains how Nvidia’s big drop in stock valuation this week, driven by DeepSeek, affected Bitcoin’s price.

The Best Brokers of the Year
SPONSORED Explore top-quality choices worldwide and locally. Compare key features like spreads, leverage, and platforms. Find the right broker for your needs, whether trading CFDs, Forex pairs like EUR/USD, or commodities like Gold.