Polkadot’s soaring development activity teases DOT price rebound
- Polkadot’s development activity rises to a three-month high – a bullish signal in the wake of recent losses.
- A buy signal from the MACD indicator saw DOT price break above a descending channel to affirm the bulls’ comeback.
- DOT price is required to close the day above the 50-day SMA; otherwise, a reversal may ensue to test support at $7.00.

Polkadot price is inching higher from support it recently embraced at $6.81. The parachain token teeters at $7.22, while bulls struggle with dispersing the stubborn seller concentration around $7.30. Higher support is needed to keep bears in check and ensure the path of least resistance stays on the upside.
Polkadot’s development activity is on the rise as more projects get onboard
On Tuesday, Polkadot’s team shared a long Twitter thread on new and ongoing developments within its ecosystem. More and more existing and upcoming projects, especially in Web3, are choosing to build on the Polkadot blockchain – ascribing to readily available resources on Square One – a substrate blockchain allowing developers to quickly and easily future-proof protocols.
Currently, the development team is working on the next major software update – the v6 mainnet, which will see Trace Labs (Web3 tech builder) migrate its solutions to the new version. This will produce millions of discoverable, verifiable, valuable assets for the Polkadot ecosystem.
A persistent increase in development activity has always positively impacted Polkadot price. As people build, Polkadot’s ecosystem grows along with DOT price. Santiment’s Development Activity model confirms the team’s claim that more projects now prefer building on Polkadot. In the past, spikes in this metric have helped DOT price sustain uptrends, which explains our positive outlook on the token’s performance.
Polkadot Development Activity
What’s holding Polkadot price back from trending higher?
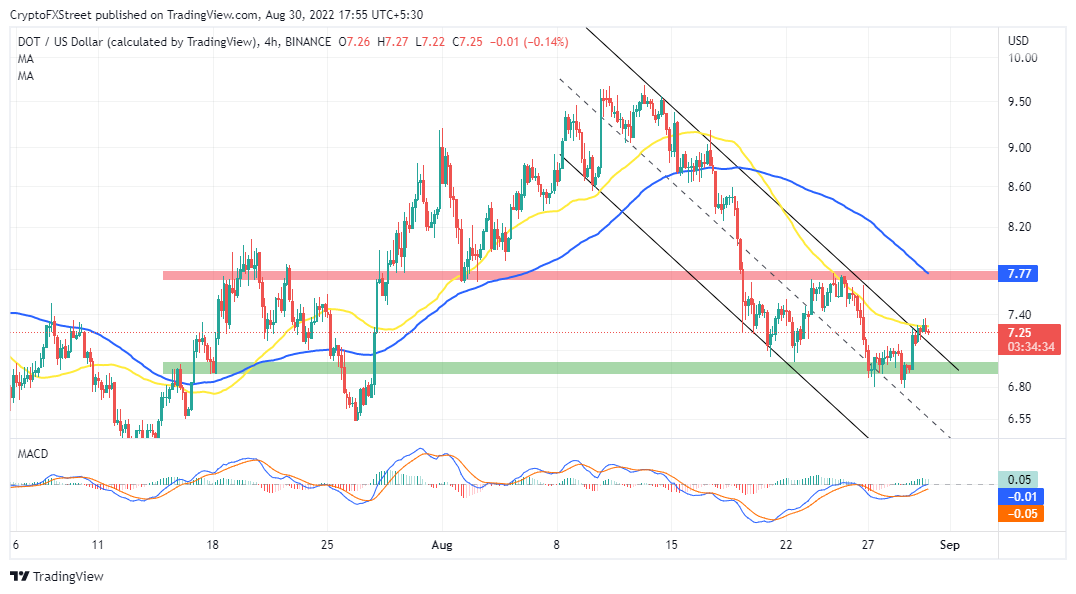
Polkadot price quickly closed the gap at $7.36 on reclaiming support above $7.00. However, bulls find it challenging to deal with the selling pressure highlighted by the 50-day Simple Moving Average (SMA).
Short-term declines will likely occur until the descending channel’s support around $7.20 is tested. A significant recovery will emerge as the Moving Average Convergence Divergence (MACD) crosses into the positive region. Moreover, buyers may win the tug of war if the 12-day Exponential Moving Average (EMA) holds above the 26-day EMA.
 [15.25.36, 30 Aug, 2022]-637974646296115892.png)
DOT/USD four-hour chart
For more conservative traders, Polkadot price is more inclined to dwell in the range highlighted on the chart between $7.00 and $7.77. A confirmed break beyond the upper range limit might catapult DOT price to $10.00. On the downside, Polkadot price is not out of the woods yet, especially with June lows well within reach.
Author

John Isige
FXStreet
John Isige is a seasoned cryptocurrency journalist and markets analyst committed to delivering high-quality, actionable insights tailored to traders, investors, and crypto enthusiasts. He enjoys deep dives into emerging Web3 tren


